2
$\begingroup$

I'm trying to get an understanding of how to calculate the sums of squares values in a mixed-model ANOVA (mathematically, not just the syntax for R or SPSS!). I've been trying to figure this out for a long time, but can never seem to find a suitably straightforward explanation of it.

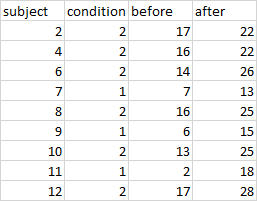
To make things concrete, let's say we have the following (completely fabricated) dataset that I want to run a mixed-model ANOVA on:

enter image description here

before and after are measures of some dependent variable before and after a treatment, and condition is a between-subjects variable specifying the nature of that treatment. How would I go about calculating the sums of squares values for this data? Furthermore, how would I go about calculating F statistics for each factor in the analysis?

Bonus points if you can explain to me how this all relates to linear mixed-effects models or multilevel modelling. I've tried to understand ANOVA in terms of regression, but have become quite lost in doing so.

$\endgroup$
1
  • 1
    $\begingroup$ Equations are fairly simple for a balanced design, which yours is not. // Suggest you start your explorations with 12 subjects, with 6 each at Cond 1 and 2. $\endgroup$
    – BruceET
    Commented Nov 14, 2019 at 21:43

1 Answer 1

2
$\begingroup$

Essentially how it works is that you have the treatment effects, and to get those you take the factor level mean and subtract the sum of the effects of all outside factors

Treatment = factor level mean - sum(effects of outside factors)

For example if you were doing a BF1 and wanted to see the treatment effect of the first variable you would take the grand mean and subtract it from the mean one of the levels of the variable.

To solve for the Sum of Squares, you simply take that treatment effect for all observations (the treatment effect should be equal across all observations for that specific treatment), and you sum the squares. In other words it would be

sum((treatment effect)^2)

To solve for F-statistic you first need to solve for the mean of the squares which is the SS/df or the sum of squares divided by the degrees of freedom, to which you can then solve for the F-statistic which is in most cases the mean of squares of the variable you are testing/mean of squares of the residuals

MS(Variable)/MS(Residuals) = F-Stat

There are a few cases where that is not true, but I do not believe this to be one of these cases.

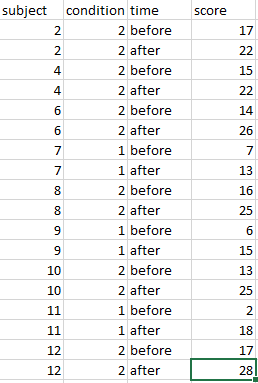
I would rearrange your data to be in long format and you can easily do the manual but not so manual calculations in excel.

Something like this

enter image description here

$\endgroup$

Your Answer

By clicking “Post Your Answer”, you agree to our terms of service and acknowledge you have read our privacy policy.

Not the answer you're looking for? Browse other questions tagged or ask your own question.