3
$\begingroup$

I want to use Pareto distribution for the stock price probability distribution. They say (B. Mandelbrot and N. Taleb Mild vs Wild Randomness) it represents the price changes, especially the tail events, better than the normal distribution.

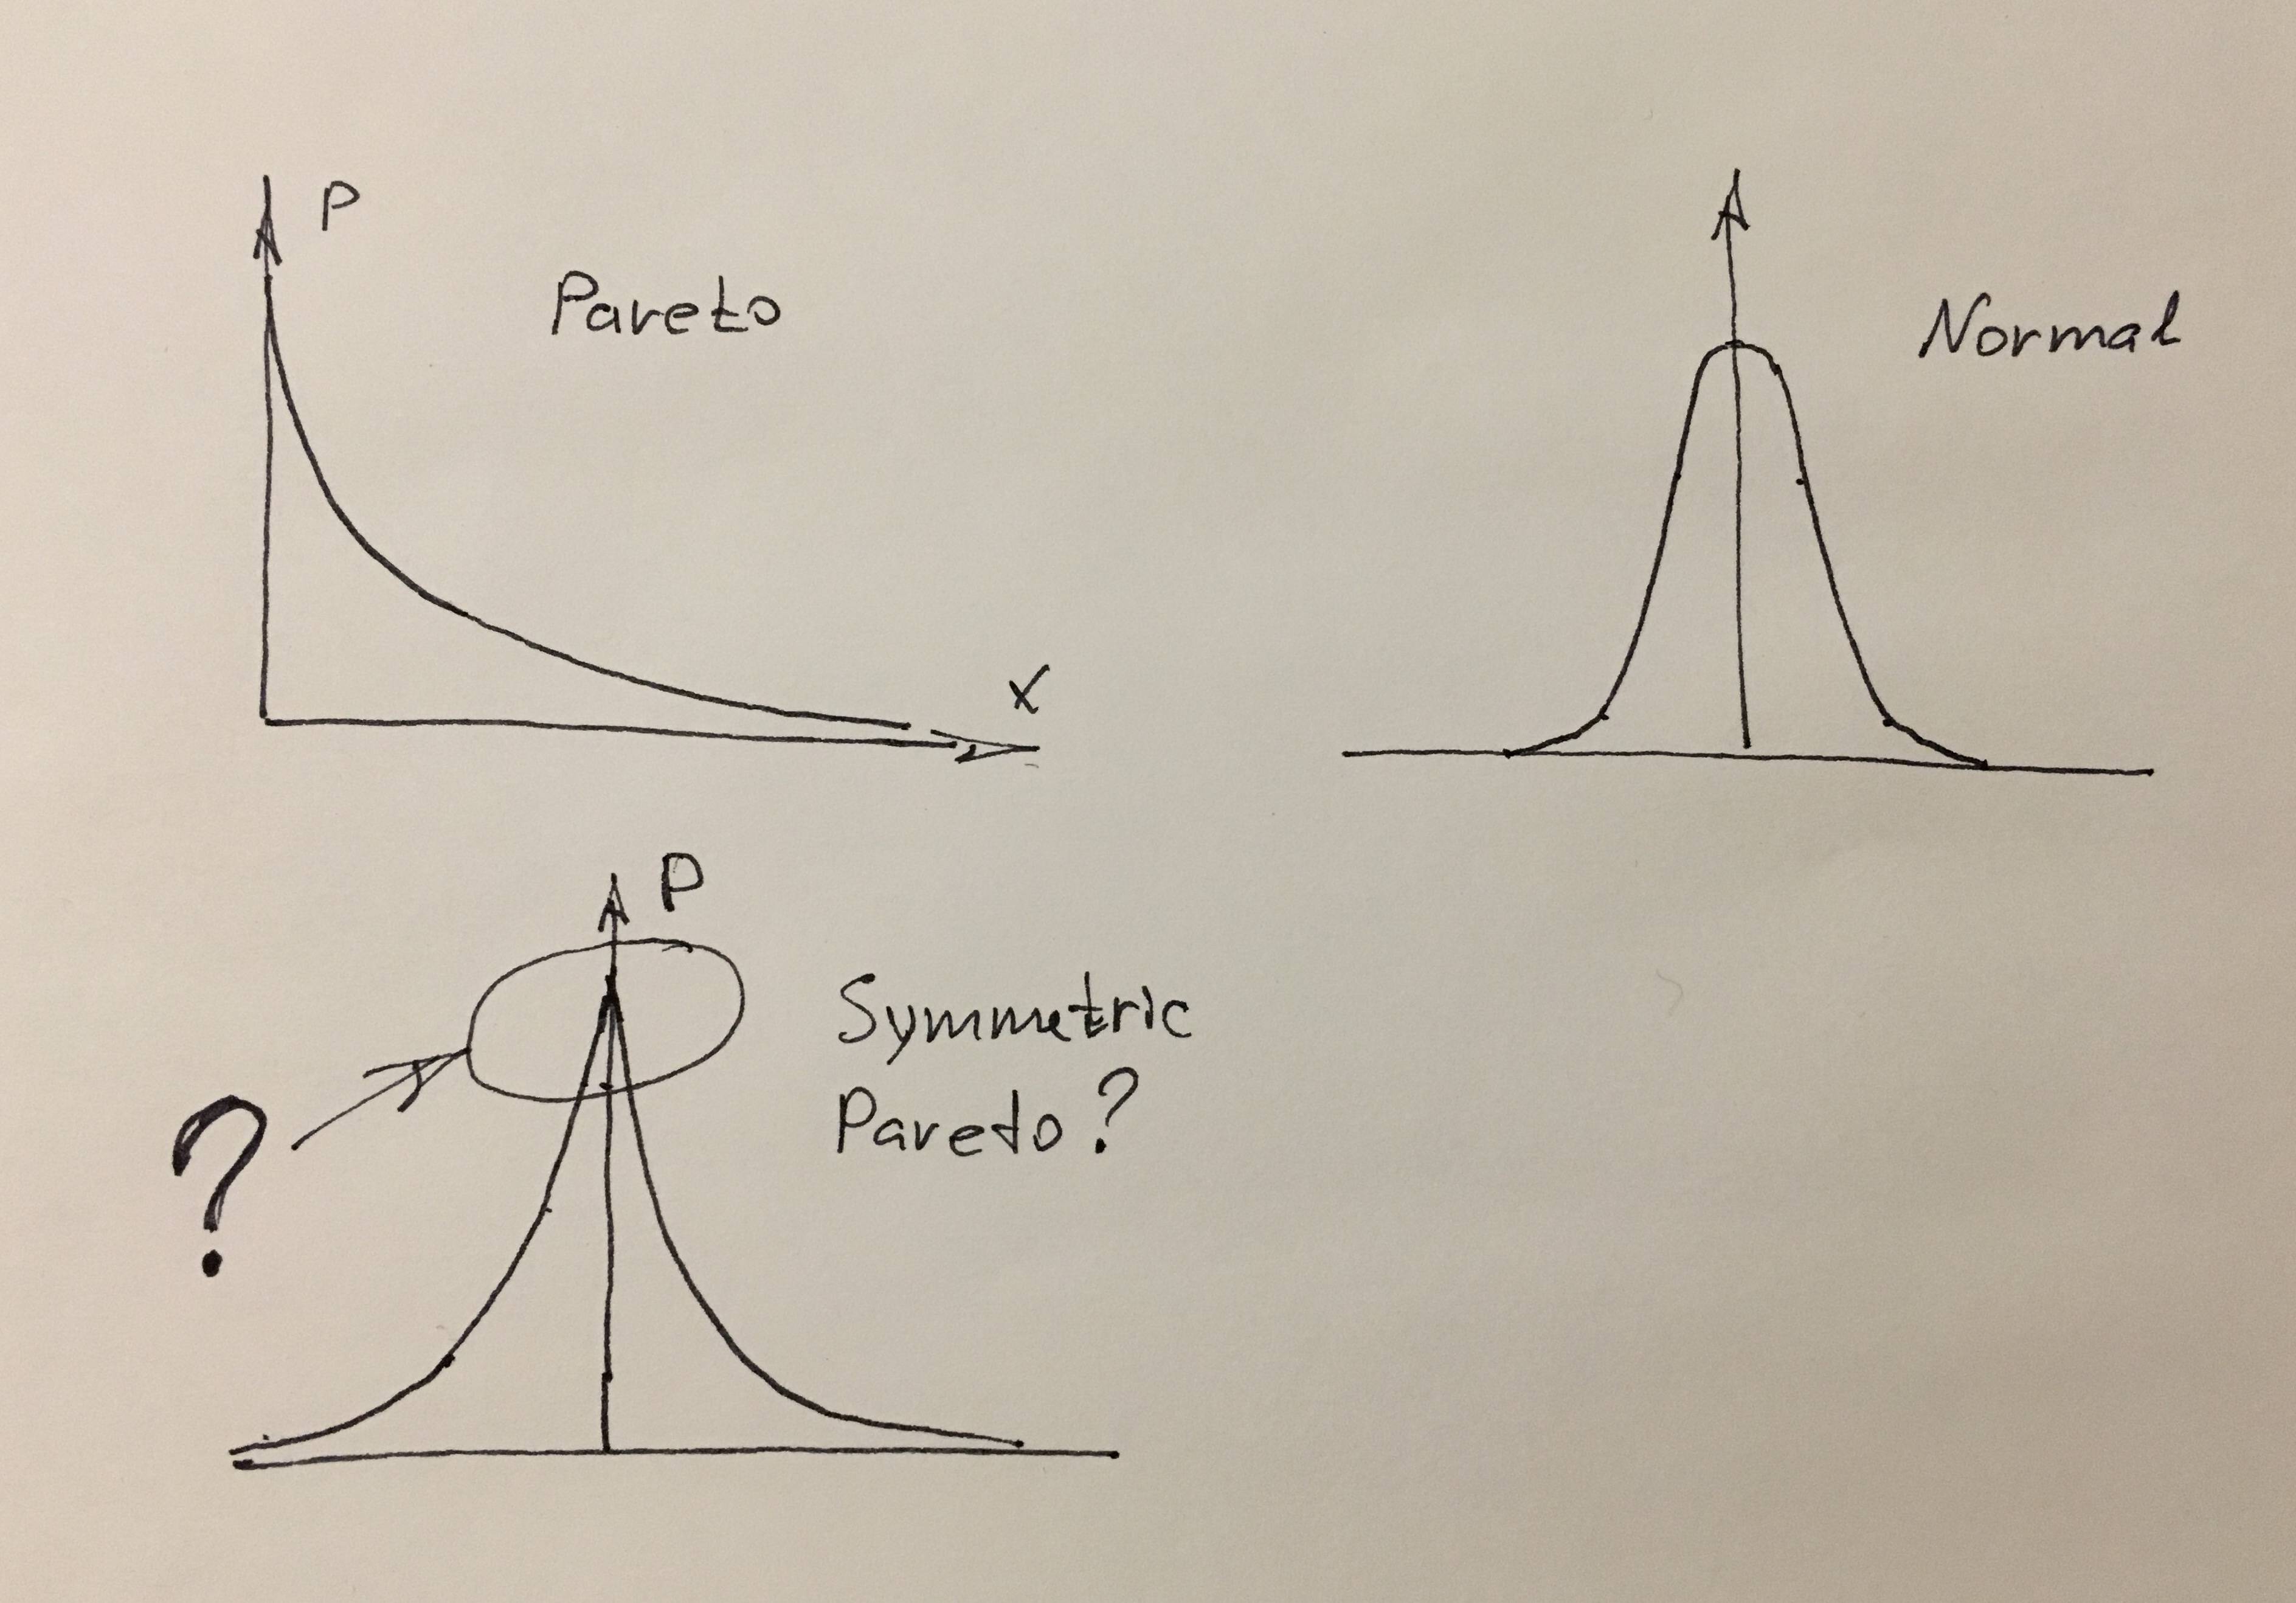
1) If the difference between Pareto and Normal distributions mostly in tails - why they have different heads too? One is round another is pointy. Is it because Pareto one-sided, if so how its symmetric form would look like?

enter image description here

2) How to use Pareto to replace the Normal in price distribution? What to do with the fact that it's one-sided and has pointy head. It could be mirrored to another side, but the head still be pointy. Also, it could be blended with Normal, use Normal for head (let's say till one sigma) and Pareto for tail (more than one sigma) and normalise it to sum to 1. I don't need the analytical solution, just good enough approximation for numerical computations.

$\endgroup$
4
  • $\begingroup$ “They say...” Who is “they”? What did they do in their analysis? By the way, we have a quantitative finance stack where you might want to ask this instead. $\endgroup$
    – Dave
    Commented Dec 7, 2019 at 20:26
  • $\begingroup$ @Dave B. Mandelbrot and N. Taleb, I updated the question and added the link to the article. $\endgroup$
    – Alex Craft
    Commented Dec 7, 2019 at 20:28
  • 1
    $\begingroup$ Your title questions are both somewhat odd; For the first it's unclear what kind of explanation you're looking for; if you take a power function $kx^{-(\alpha+1)}$ for positive $\alpha$ it has that shape; we gave the corresponding density the name Pareto because of its connection to Vilfredo Pareto, who used it to describe the distribution of wealth. The second question in the title seems to assume there's only one possible symmetric distribution that can be produced from the Pareto ("the" symmetrical version). If you decide to flip it about its left boundary, it must look like ... $\endgroup$
    – Glen_b
    Commented Dec 7, 2019 at 22:26
  • $\begingroup$ ... the diagram you have, but what purpose does that serve in this context? Why would stock prices be either normal or like that symmetrized Pareto? Prices are not stationary, so it's not clear that it makes sense to focus on prices per se. Log-returns can look close to normal in the middle but have heavier tails, but they are not symmetric (even after accounting for changing volatility, they're not conditionally symmetric). $\endgroup$
    – Glen_b
    Commented Dec 7, 2019 at 22:29

1 Answer 1

2
$\begingroup$

As far as I remember a probability density distribution $f(x)$ has to satisfy two conditions:

  1. As a negative probability would not make sense, it must be either positive or zero, $f(x)\ge 0$, for all $x$.
  2. It must "sum" to one, $\int dx f(x) = 1$

Maybe there is a third condition, which I can't remember. You should look it up.

As these conditions are rather easy to satisfy, you should not stick to the well-known distributions and try to fix their shortcomings, but rather define your own density distribution. The procedure is simple:

  1. Use any positive function to describe your density distribution. Let's call this function $f_N(x)$. The important point is that $f_N(x)$ hast to satisfy the first condition for all $x$ within the support.
  2. Now we normalize the distribution. Thus, we first find the normalisation factor by integrating the function from $-\infty$ to $\infty$. Let's call this normalisation factor $N := \int_{-\infty}^\infty dx f_N(x)$. By dividing $f_N(x)$ by this normalisation factor, we obtain a probability density function, $f(x) :=\frac{1}{N} f_N(x) = \frac{f_N(x)}{\int_{-\infty}^\infty dx f_N(x)}$
$\endgroup$

Your Answer

By clicking “Post Your Answer”, you agree to our terms of service and acknowledge you have read our privacy policy.

Not the answer you're looking for? Browse other questions tagged or ask your own question.