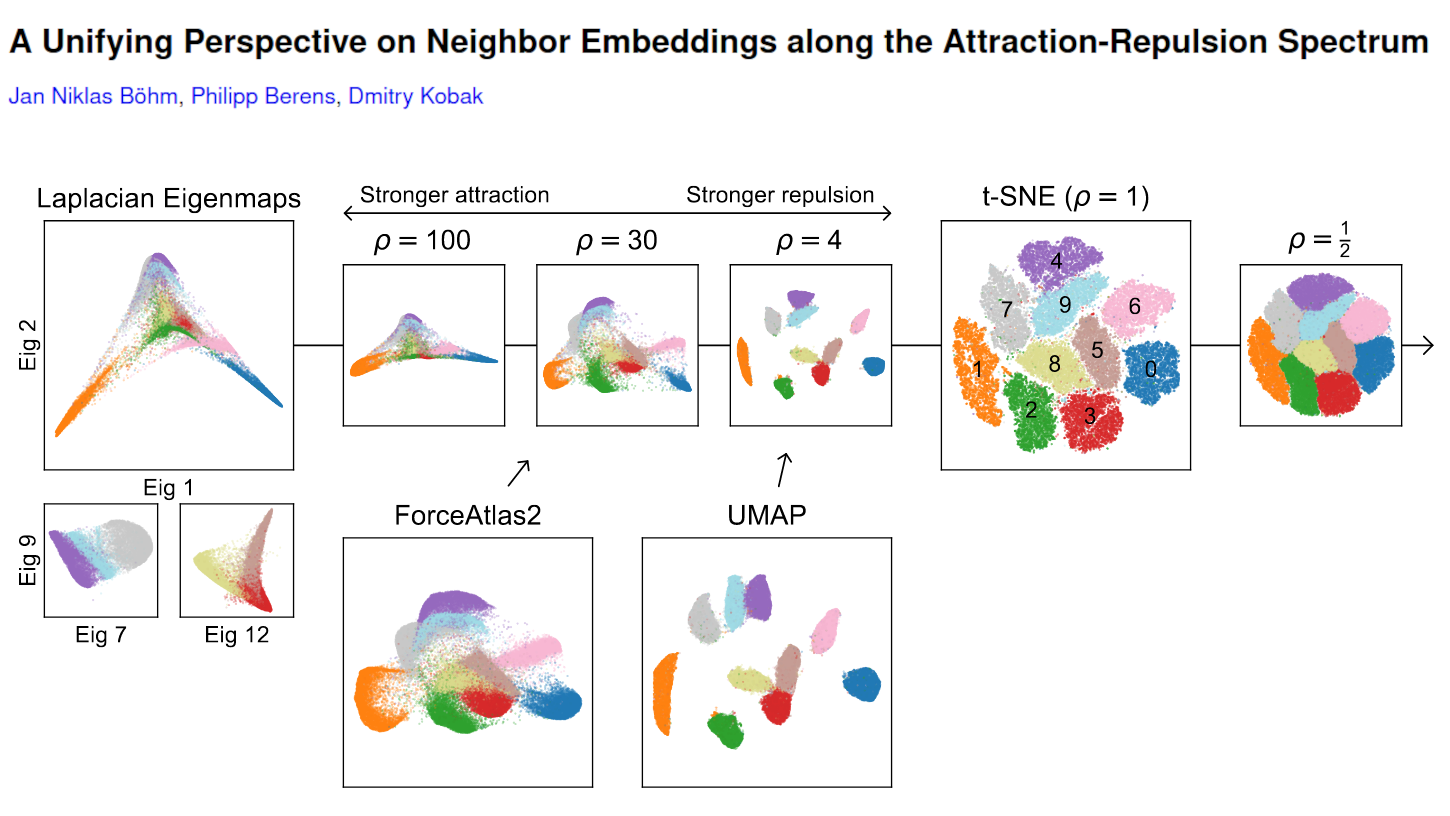
Can you help me with a conceptual explanation of how force directed graph drawings work compared to other methods in the context of dimensionality reduction for visualization purposes?
In particular, I'm interested in comparisons with diffusion maps, and t-SNE (or similar non-linear methods like UMAP). While I've found a lot of explanations of PCA, t-SNE, and UMAP, I've not found much on force directed graphs and diffusion maps.

