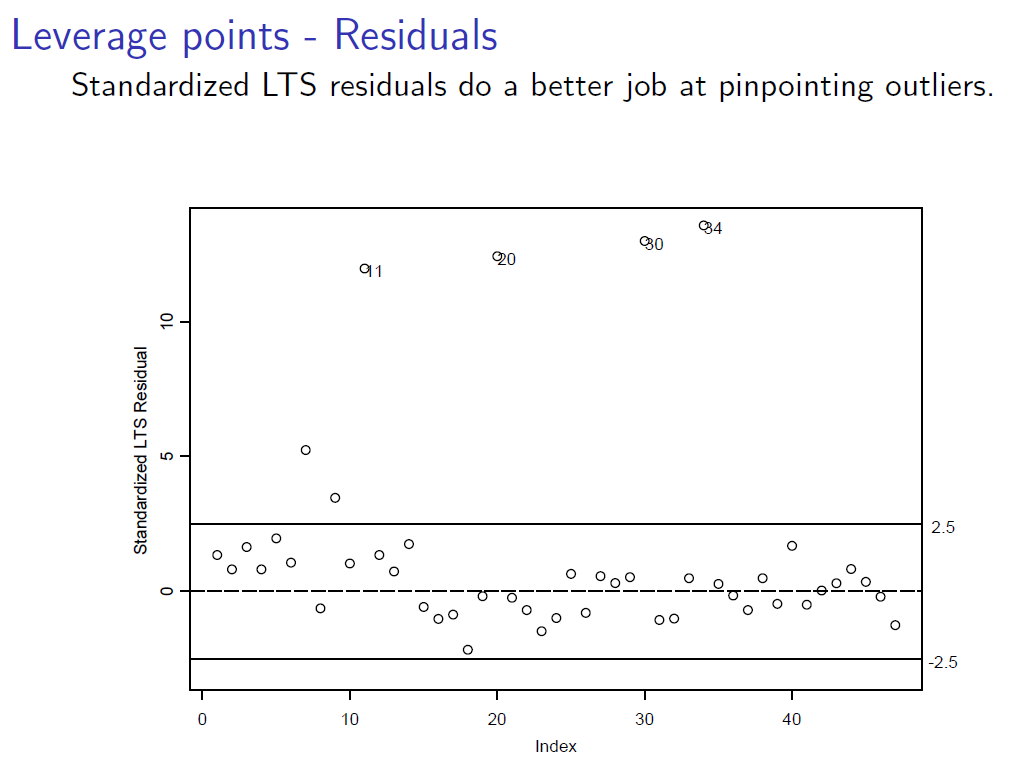
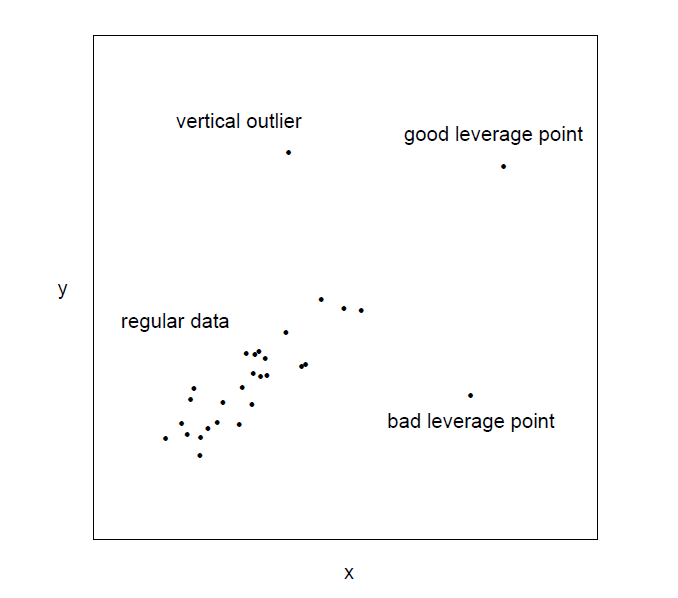
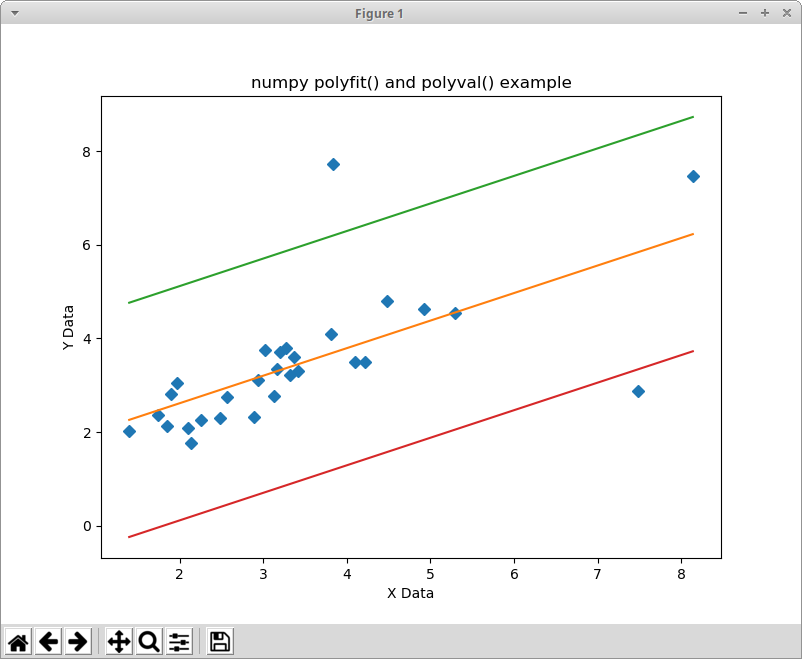
I suggest you create a data set with the three types of outlier and then fit a regression model to the data with all three outliers removed. Now, look at the same model fit to the data set with just one of the types added back in, and then repeat this process two more times. What you should see is that adding the vertical outlier will have relatively little effect on the estimated slope but will increase the standard error, adding the "good outlier" will have relatively little effect on the estimated slope but will decrease the standard error (and not in a good way), and adding the bad outlier will especially affect the estimated slope (see below with the three outliers at the end of the data).
mydata <- data.frame(matrix(c(1,1,2,2,2,2,3,3,3,3,3,3,4,4,4,4,4,4,4,4,4,4,5,5,5,5,5,5,6,6,6,6,7,7,4,20,20,20,20,4),ncol=2,byrow=TRUE))
names(mydata) <- c("x","y")
set.seed(1234)
mydata <- mydata+rnorm(40,0,0.1)
mydata
##             x         y
## 1   0.8792934  1.013409
## 2   2.0277429  1.950931
## 3   2.1084441  1.955945
## 4   2.7654302  3.045959
## 5   3.0429125  2.930628
## 6   3.0506056  2.855180
## 7   3.9425260  4.057476
## 8   3.9453368  3.897634
## 9   3.9435548  3.998486
## 10  3.9109962  3.906405
## 11  3.9522807  4.110230
## 12  4.9001614  4.952441
## 13  4.9223746  4.929056
## 14  5.0064459  4.949874
## 15  6.0959494  5.837091
## 16  5.9889715  5.883238
## 17  6.9488990  6.781996
## 18  3.9088805 19.865901
## 19 19.9162828 19.970571
## 20 20.2415835  3.953410
summary(lm(y ~ x, data = mydata[-c(18,19,20),]))
##
## Call:
## lm(formula = y ~ x, data = mydata[-c(18, 19, 20), ])
##
## Residuals:
##       Min        1Q    Median        3Q       Max
## -0.203052 -0.117649 -0.000694  0.076298  0.263643
##
## Coefficients:
##             Estimate Std. Error t value Pr(>|t|)
## (Intercept)  0.10668    0.09183   1.162    0.264
## x            0.96753    0.02158  44.828   <2e-16 ***
## ---
## Signif. codes:  0 '***' 0.001 '**' 0.01 '*' 0.05 '.' 0.1 ' ' 1
##
## Residual standard error: 0.137 on 15 degrees of freedom
## Multiple R-squared:  0.9926, Adjusted R-squared:  0.9921
## F-statistic:  2010 on 1 and 15 DF,  p-value: < 2.2e-16
summary(lm(y ~ x, data = mydata[-c(19,20),]))
##
## Call:
## lm(formula = y ~ x, data = mydata[-c(19, 20), ])
##
## Residuals:
##     Min      1Q  Median      3Q     Max
## -1.1184 -0.9854 -0.8684 -0.7738 15.0885
##
## Coefficients:
##             Estimate Std. Error t value Pr(>|t|)
## (Intercept)   1.0800     2.5927   0.417    0.683
## x             0.9459     0.6120   1.546    0.142
##
## Residual standard error: 3.884 on 16 degrees of freedom
## Multiple R-squared:  0.1299, Adjusted R-squared:  0.07552
## F-statistic: 2.389 on 1 and 16 DF,  p-value: 0.1418
summary(lm(y ~ x, data = mydata[-c(18,20),]))
##
## Call:
## lm(formula = y ~ x, data = mydata[-c(18, 20), ])
##
## Residuals:
##       Min        1Q    Median        3Q       Max
## -0.240295 -0.093376 -0.008793  0.078497  0.297234
##
## Coefficients:
##              Estimate Std. Error t value Pr(>|t|)
## (Intercept) -0.015162   0.053578  -0.283    0.781
## x            0.999442   0.008565 116.693   <2e-16 ***
## ---
## Signif. codes:  0 '***' 0.001 '**' 0.01 '*' 0.05 '.' 0.1 ' ' 1
##
## Residual standard error: 0.1435 on 16 degrees of freedom
## Multiple R-squared:  0.9988, Adjusted R-squared:  0.9988
## F-statistic: 1.362e+04 on 1 and 16 DF,  p-value: < 2.2e-16
summary(lm(y ~ x, data = mydata[-c(18,19),]))
##
## Call:
## lm(formula = y ~ x, data = mydata[-c(18, 19), ])
##
## Residuals:
##     Min      1Q  Median      3Q     Max
## -2.3942 -0.8256  0.1345  0.9843  2.5573
##
## Coefficients:
##             Estimate Std. Error t value Pr(>|t|)
## (Intercept)   3.2893     0.5297   6.209 1.25e-05 ***
## x             0.1346     0.0839   1.604    0.128
## ---
## Signif. codes:  0 '***' 0.001 '**' 0.01 '*' 0.05 '.' 0.1 ' ' 1
##
## Residual standard error: 1.43 on 16 degrees of freedom
## Multiple R-squared:  0.1386, Adjusted R-squared:  0.08476
## F-statistic: 2.574 on 1 and 16 DF,  p-value: 0.1282
As you note, they all cause problems, but the problems are different enough to make it worthwhile distinguishing between the types.


