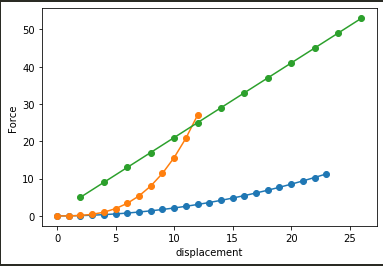
I have a library of 2D data sets (force versus displacement graphs) for different materials. Usually, a customer/user gives me a force vs displacement graph for their part behaviour. I would search my library and tell them which material force vs displacement graph is closer and hence it is better to use that material for the part.
What do I mean by "close"?
Two graphs should always have an overlapping displacement domain (at least tiny bit). If there is no overlap there is no point in comparison.
Physical explanation : If the customer part has a displacement range of 0 to 10 mm, then there is no point in looking at materials that have displacement range 11 to 50 mm.
It is preferred to have a force greater than or equal to the input force for a displacement, as designing the part with a material that can withstand a smaller force will definitely break it.
I have to write a program that takes a 2D data set, the aforementioned force (y axis) versus displacement (x axis), compare it with around 600 2D data sets and find the closest data set to the input data.
The 2D data sets are non-parametric and independent, i.e. have no kind of distribution nor share same values/interval $\Delta x$ for X-coordinates within a data set or between two data sets. All the data sets (including input data set) either have positive or negative slope.
I plotted 3 of 600 data sets just for reference.
What statistical parameters should be compared? What statistical tests should I use?

