1
$\begingroup$

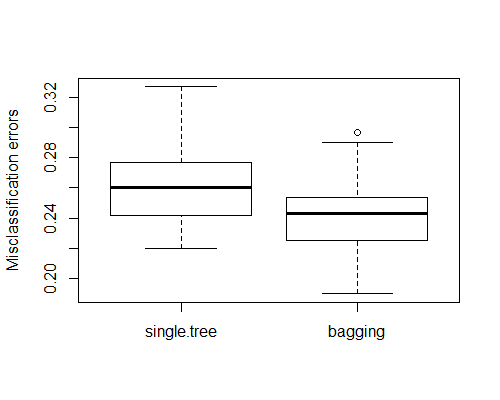
I'm running the classification method Bagging Tree (Bootstrap Aggregation) and compare the misclassification error rate with one from one single tree. We expect that the result from bagging tree is better then that from one single tree, i.e. error rate from bagging is lower than that of single tree.

I repeat the whole procedure M = 100 times (each time splitting randomly the original data set into a training set and a test set) to obtain 100 test errors and bagging test errors (use a for loop). Then I use boxplots to compare the distributions of these two types of errors.

# Loading package and data
library(rpart)
library(boot)
library(mlbench)
data(PimaIndiansDiabetes)

# Initialization
n <- 768
ntrain <- 468
ntest <- 300
B <- 100
M <- 100
single.tree.error <- vector(length = M)
bagging.error <- vector(length = M)

# Define statistic
estim.pred <- function(a.sample, vector.of.indices)
      {
      current.train <- a.sample[vector.of.indices, ]
      current.fitted.model <- rpart(diabetes ~ ., data = current.train, method = "class")
      predict(current.fitted.model, test.set, type = "class")
      }

for (j in 1:M)
      {
      # Split the data into test/train sets
      train.idx <- sample(1:n, ntrain, replace = FALSE)
      train.set <- PimaIndiansDiabetes[train.idx, ]
      test.set <- PimaIndiansDiabetes[-train.idx, ]

      # Train a direct tree model
      fitted.tree <- rpart(diabetes ~ ., data = train.set, method = "class")
      pred.test <- predict(fitted.tree, test.set, type = "class")
      single.tree.error[j] <- mean(pred.test != test.set$diabetes)


      # Bootstrap estimates
      res.boot = boot(train.set, estim.pred, B)
      pred.boot <- vector(length = ntest)
      for (i in 1:ntest)
            {
            pred.boot[i] <- ifelse (mean(res.boot$t[, i] == "pos")  >= 0.5, "pos", "neg")
            }
      bagging.error[j] <- mean(pred.boot != test.set$diabetes)
      }

boxplot(single.tree.error, bagging.error, ylab = "Misclassification errors", names = c("single.tree", "bagging"))

The result is

enter image description here

Could you please explain why the error rate for bagging trees is much higher than that of a single tree? I feel that this does not make sense. I've checked my code but could not found anything unusual.

$\endgroup$
3
  • $\begingroup$ Generally speaking, this would be off-topic for this site, since it's a coding question and therefore belongs somewhere on StackExchange, but I've answered it here anyway. $\endgroup$
    – jbowman
    Commented Mar 6, 2020 at 0:41
  • $\begingroup$ @jbowman: in the OP's defense, I believe they thought they had what would have been an on topic question, but you realized was just a coding error. $\endgroup$
    – Cliff AB
    Commented Mar 6, 2020 at 0:52
  • $\begingroup$ @CliffAB - ah, I see. I guess I didn't pay enough attention to the last paragraph. $\endgroup$
    – jbowman
    Commented Mar 6, 2020 at 0:57

1 Answer 1

1
$\begingroup$

When forming the bootstrap estimates, you have the line of code:

pred.boot[i] <- ifelse (mean(res.boot$t[, i] == "pos") >= 0.5, "pos", "neg")

which doesn't work, as res.boot$t is not a matrix of factors that map to "pos" and "neg", but instead a matrix of integers taking on the values of $1$ or $2$. Consequently, the equality is always false, the mean is always $0$, and pred.boot is a vector filled with "neg".

You can take advantage of your knowledge of how factors are ordered and replace that line with:

pred.boot[i] <- ifelse (mean(res.boot$t[, i] == 2) >= 0.5, "pos", "neg")

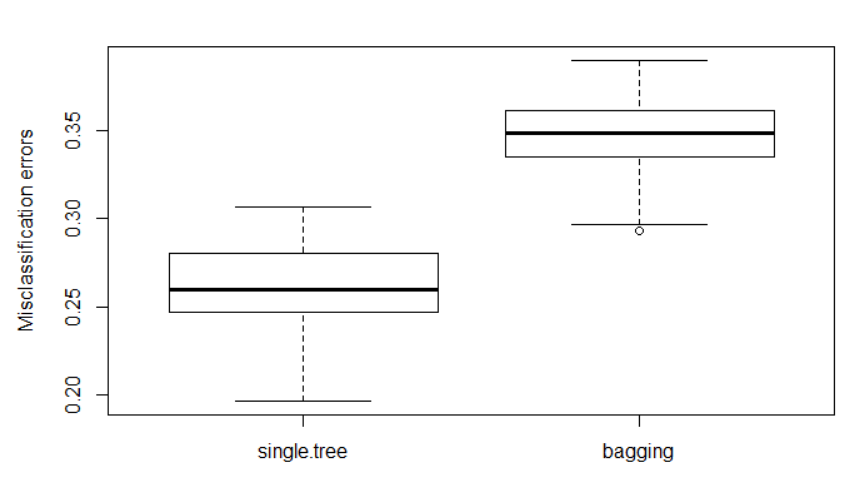
which generates the following boxplot:

enter image description here

which is in line with what we expect.

$\endgroup$
4
  • $\begingroup$ Thank you so much for saving my life! $\endgroup$
    – Akira
    Commented Mar 6, 2020 at 8:00
  • $\begingroup$ It's strange to me because the function estim.pred returns a matrix of factors that map to "pos" and "neg", but the res.boot$t returns a matrix of integers taking on the values of $1$ or $2$, where as estim.pred is the statistic of res.boot$t. $\endgroup$
    – Akira
    Commented Mar 6, 2020 at 8:08
  • $\begingroup$ You're welcome! But the key is that the bootstrap function acts as if it doesn't know the factor values themselves, so it just returns the levels $(1,2)$; and as a result the return values are disassociated from the factor values. This could be easily fixed in the bootstrap code, it seems to me. You could also fix that with a small wrapper around the boot function that would just make the appropriate elements of res.boot into factors before returning it to the calling block. $\endgroup$
    – jbowman
    Commented Mar 6, 2020 at 13:09
  • $\begingroup$ If you don'r mind, please have me answer my last question. Actually, this is a preparation for my final exam on Big Data tomorrow. $\endgroup$
    – Akira
    Commented Mar 6, 2020 at 17:19

Your Answer

By clicking “Post Your Answer”, you agree to our terms of service and acknowledge you have read our privacy policy.

Not the answer you're looking for? Browse other questions tagged or ask your own question.