0
$\begingroup$

I am trying to forecast time series of product sales, I started approaching the problem by implementing the ARIMA model, I iterated over all the possibilities of the models parameters (p, d, q) and picked the one with least RMSE, problem is the forecast is not as good as I wanted it to be, so I started studying other ways of prediction, like regression.

After plotting my data in a cumulative plot, I noticed that most of the time series I had are fairly linear, so probably I can fit a linear regression model on them.

What should I use in my case, ARIMA model or linear regression, and what does ARIMA model has to offer than regression does not for it to compensate for being more complicated.

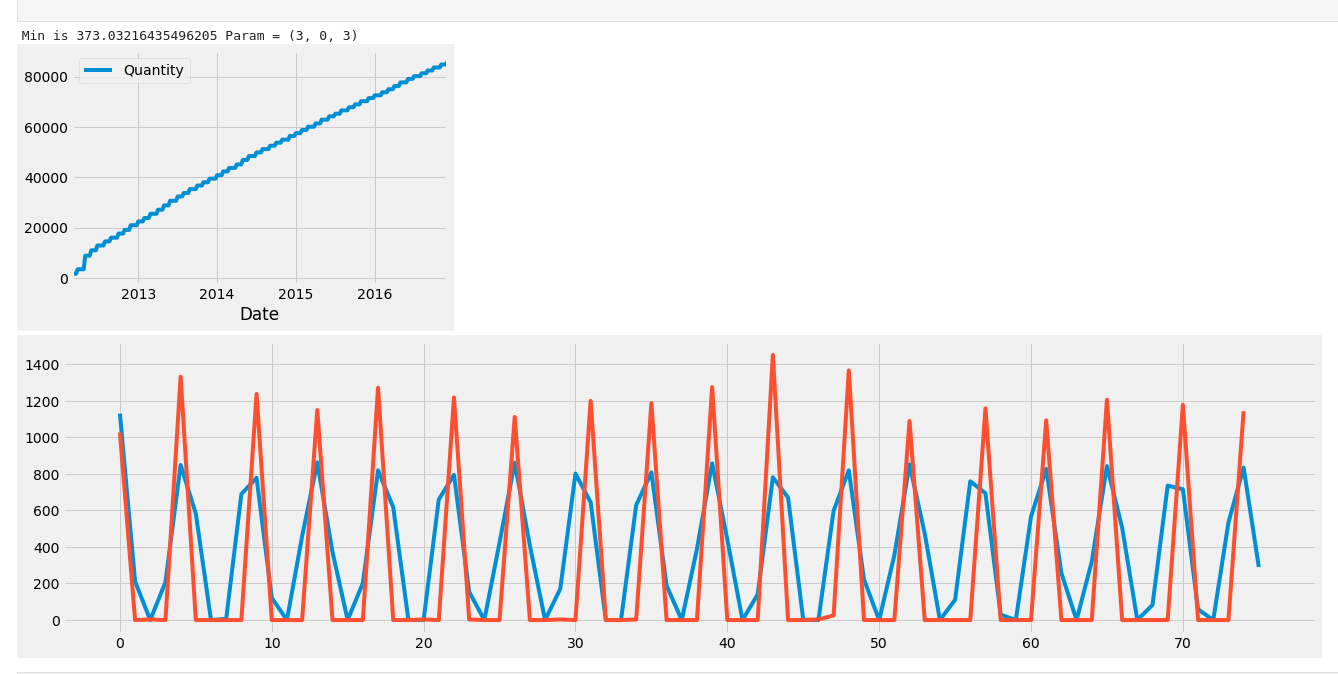
Here is a screenshot of my ARIMA forecast, and cumulative plot (weekly):

enter image description here

Note that 373 is the RMSE of the time series forecast, blue is prediction, red is test data

enter image description here

This is my data per month, the model is acting even worse in predicting the data.

$\endgroup$

1 Answer 1

0
$\begingroup$

First of all … you should model what is observed NOT what is accumulated . Secondly an ARIMA model can evolve into a time trend model with Intervention Detection with the potential of detecting breakpoints in trend. Stay way clear of simple ols models with trend or trend squared unless theory ( domain knowledge )tells you so .

Closely review a piece I wrote contrasting and comparing ARIMA with Regression a few years back. https://autobox.com/pdfs/regvsbox-old.pdf

EDITED AFTER RECEIPT OF INTERMITTENT DEMAND DATA:

The data you have ( although daily ) does not have values for every day thus one can't build a daily model like Simple method of forecasting number of guests given current and historical data

Secondly you don't have data for each and every week of the year thus you can't build a weekly model as is done in these examples https://stats.stackexchange.com/search?q=user%3A3382+weekly

So all you have left is a monthly model. I propose that you reassemble your data into monthly buckets (totals by month) and repost your data to the web and I will try and help further.

EDITED AFTER RECEIPT OF 46 MONTHLY VALUES STARTING ATT 2012/3:

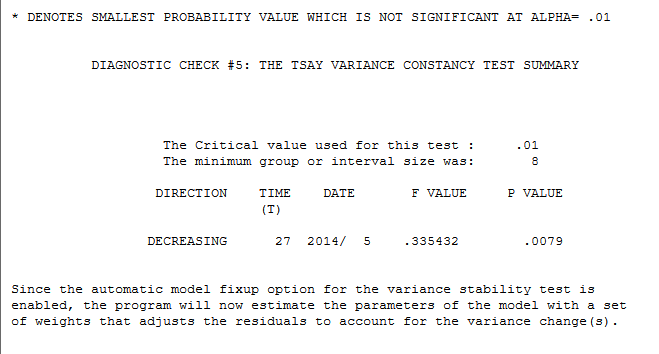
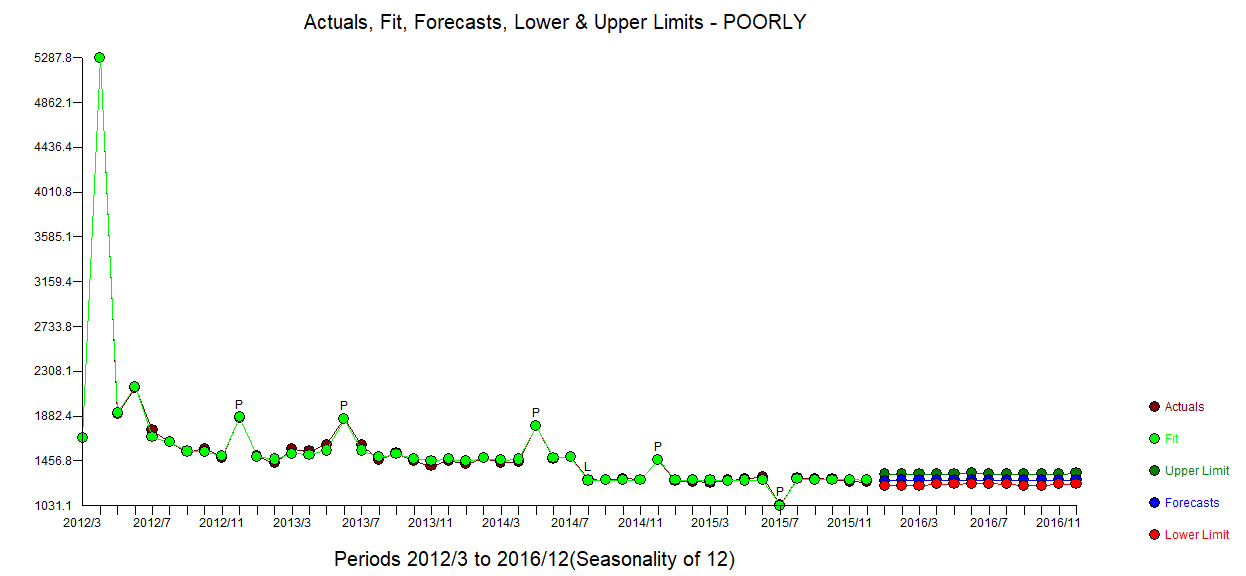
You say "how poorly ARIMA model is predicting my monthly data: . I say your chice of arima software and approach is performing poorly due to at least 3 Gaussian violations viz 1) There are identifiable pulses in the data ; 2) There is an identifiable level/step shift down in the data ; 3) there is an identifiable error variance reduction/change in the data. I used AUTOBOX which I have helped to develop which has features to deal with data like this.

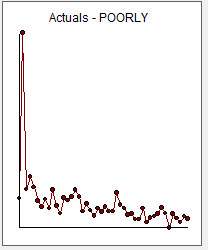
Your data is here enter image description here

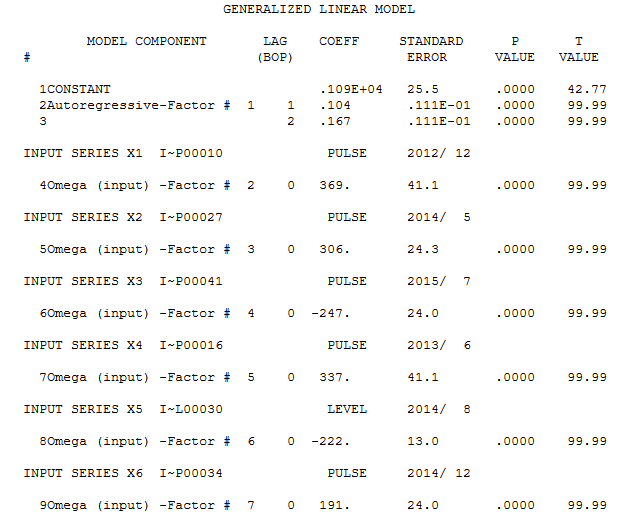
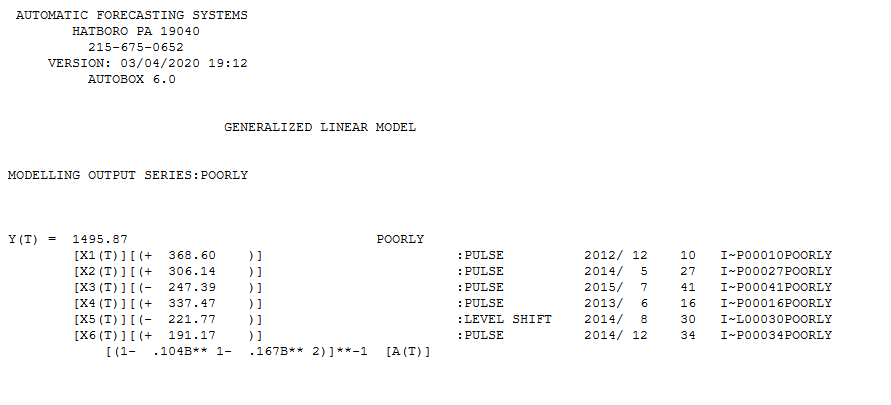
A useful arima model is here (2,0,0)(0,0,0)12 enter image description here and here enter image description here

A significant reduction in the model error variance was detected at period 27 enter image description here

The Actual/Fit and Forecast graph is here enter image description here

$\endgroup$
7
  • $\begingroup$ Hello, thanks for your answer. As observed from the time series plot, there is a periodical peak, this happens every first week in a month, how would you approach making a model that capture this property (my model does two or three medium peaks, instead of a one large peak). Also I'm still quite novice in forecasting, if you could simplify your answer. Thanks a lot! $\endgroup$ Commented Mar 12, 2020 at 19:23
  • $\begingroup$ why don't you post your data and I will try and help you further $\endgroup$
    – IrishStat
    Commented Mar 12, 2020 at 20:02
  • $\begingroup$ Here is the file: drive.google.com/open?id=1MRI360reUSanclxJ5vZy1se5v2npxBFR , its for one product, I have 75 that I need to predict. But all of them have this same characteristic, sales peak at the first day of the week, or the first week of the months. And thanks a lot for the help! $\endgroup$ Commented Mar 12, 2020 at 20:52
  • $\begingroup$ Hey, thanks for reviewing my data, and sorry for the late reply I didn't get notified of the update in the answer. My data is not missing, for this specific product, and most products sales are not being made daily (its a gaz company, usually hospitals, factories only order liquide gaz at the beginning of months or weeks). My goal is do a model that capture this feature, my ARIMA model seem to struggle to do it, but still it acts better in weekly aggregates than monthly aggregate. $\endgroup$ Commented Mar 13, 2020 at 17:14
  • $\begingroup$ Here is the data for the same product per month: drive.google.com/open?id=1fJQuPAQ2u7QE8Lnfxg2FArSqRCZC8WPA I've also updated my question with a graph representing how poorly ARIMA model is predicting my monthly data. $\endgroup$ Commented Mar 13, 2020 at 17:21

Your Answer

By clicking “Post Your Answer”, you agree to our terms of service and acknowledge you have read our privacy policy.

Not the answer you're looking for? Browse other questions tagged or ask your own question.