1
$\begingroup$

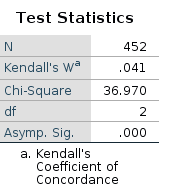
I have a repeated measurement of n=452 participants. The Friedman test of SPSS gives df=2, chi-square 36.970 whereas below is the output of R and python. I cannot explain this difference for chi-square value (30 from R and python vs 36 from SPSS) although it is not too much. Can anyone help me understand this? When I test for my other data, this happens only to two out of 6 groups of repeated measures. For the rest, the values are equal between platforms. Python and R always behave the same and the only difference is with SPSS.

#Friedman rank sum test in R        
friedman.test(data.matrix(x))
data:  data.matrix(x)
Friedman chi-squared = 30.389, df = 2, p-value = 2.518e-07

#----------------------------------------------

#Friedman Test in python
friedmanchisquare(x1, x2, x3)

FriedmanchisquareResult(statistic=30.38907395069963, pvalue=2.5182360483490374e-07)

SPSS output enter image description here

I tried looking up the implementations, but I could not figure out something myself. Here is the python implementation of Friedman: https://github.com/scipy/scipy/blob/v0.15.1/scipy/stats/stats.py#L4211

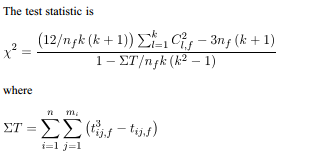
And here is the IBM SPSS documentation: enter image description here
I need to know which output to include in my paper.

$\endgroup$

2 Answers 2

6
$\begingroup$

This was my initial reply, to which the comments below were directed: I suggest checking carefully to make sure that the data values are identical in the programs, because when I compare results for SPSS and R I get identical results. I've tried with and without ties, and with and without some missing data, and the programs always give the same values.

Follow up after the comments, giving more information:

You're welcome. I suspected that the data were "fuzzy" and the answer you wanted was the one given by SPSS, which required recognizing that A_1 values were tied in some cases with A_2 and/or A_3 values where they were actually slightly different.

The Friedman test involves ranking values within each case across the dependent variables or repeated measures, then applying a standard formula to calculate a test statistic asymptotically distributed as chi-squared under the null hypothesis. The versions of the formula used in SPSS and R appear to be arranged slightly differently, but are equivalent and generally produce the same results to a high level of precision when given the same sets of ranked values.

SPSS is using a "fuzz" check in comparing values to rank the values within each case, while R and Python appear to be taking the values as given. In this situation SPSS seems to be giving the result desired, though what's given in R and Python is closer to expected given exactly the data input.

There is a mystery remaining here for me though, which is why R and Python are getting the precise value they're getting (30.389 to three decimals), when SPSS and R both produce a value of 30.834 if I feed them the ranks within cases based on the original "fuzzy" input data. I thought perhaps R was using a tighter "fuzz" check and determined that a subset of the slight differences SPSS treated as ties were ties, but I couldn't find any value of a "fuzz" check cut off consistent with the data to make that a valid explanation. I can't explain why R is giving different results when fed the original data and the ranks based on the original data, since the calculations involve first creating those ranks and using those instead of the original data values in calculating the test statistic.

$\endgroup$
6
  • $\begingroup$ Thank you for your suggestion. I load in both from the CSV file and I have no missing values... $\endgroup$
    – Artemis
    Commented May 28, 2020 at 18:40
  • $\begingroup$ If the data are not confidential and you can post them, I can take a look. $\endgroup$ Commented May 28, 2020 at 20:44
  • $\begingroup$ Thanks, that is very kind of you. Check it here: github.com/Helma-T/CrossvalidatedData.git , this is the group that I have an issue with. Some other groups does not show this behavior. $\endgroup$
    – Artemis
    Commented May 29, 2020 at 10:03
  • 1
    $\begingroup$ The variables seem to be intended to have values from 1 to 5 in increments of .2, and this is the case for A_2 and A_3, but note that there are a number of cases for A_1 where there are values such as 3.0000000000000004 (for the 16th case). Are these really intended, or should the values all be in simple .2 increments? $\endgroup$ Commented Jun 4, 2020 at 21:45
  • $\begingroup$ @Artemis I'm still waiting on your response to my question from June 4 above. $\endgroup$ Commented Jun 12, 2020 at 16:17
1
$\begingroup$

it is all about ties! R and SPSS are using the correction factor for dealing with ties M. Hollander and D.A. Wolfe (1973). Nonparametric Statistical Methods, John Wiley & Sons, Inc.

$\endgroup$
2
  • 1
    $\begingroup$ Can you expand on this answer to make it more useful to readers? $\endgroup$
    – mkt
    Commented Jun 24, 2022 at 9:30
  • $\begingroup$ No, R and IBM SPSS Statistics give the same "treatment" to ties (average method). The problem was related to the rounding of the values (see above). $\endgroup$
    – Sinval
    Commented Jul 29, 2022 at 16:57

Your Answer

By clicking “Post Your Answer”, you agree to our terms of service and acknowledge you have read our privacy policy.

Not the answer you're looking for? Browse other questions tagged or ask your own question.