0
$\begingroup$

I have some data I'm analyzing, that looks something like this:

exampleDF <- data.frame(s1 = rnorm(10), s2 = rnorm(10), s3 = rnorm(10), s4 = rnorm(10), s5 = rnorm(10))

> exampleDF
           s1         s2          s3         s4          s5
1  -1.8167533  1.7702279 -0.71073850  1.4676012  0.11589850
2  -0.9283220 -0.6028665 -0.12541521 -0.8027177  1.01037162
3  -1.8452510  0.2370927  0.02927646  0.9991479  0.23636339
4  -1.1728676  0.8326918  1.50497972 -0.2297063  0.08417196
5   0.0526901  0.4537119 -0.95115552 -0.6845546 -0.83615065
6   1.3307005 -2.8312321  0.09037220 -2.1499721 -0.30079861
7   2.0669124 -0.3826490  0.03627688 -0.7294662 -0.13742160
8   0.4938200  0.1285557 -0.06457083  0.4582254  0.03022469
9  -1.5334708 -0.1054318  0.93166124  0.4045524  1.81366144
10 -0.1566743  0.9812490 -0.03122229 -2.1211528  0.65671646

Here, A = {s1,s2,s3} is all one experimental group and B = {s4,s5} is another group.

What I'd like to do, is go through each row, and compare the means of A and B to see if they are significantly different. i.e. for each row, compare the means of {s1,s2,s3} and {s4,s5}.

So for each row, I'd like a p-value so I can decide if the two groups are statistically significant. However, my actual data has ~20,000 rows, so I think I'm supposed to correct for multiple testing to reduce the Type 1 error rate, right? What test should I use, and how do I do it in R?

I'm not sure how to go about setting up the design matrix, and whether I should use the t.test() function in R, or if there's a more appropriate function?

$\endgroup$
2
  • $\begingroup$ I don't think this will work: with sample sizes of 2 and 3, the group differences would need to be extremely large to reach significance, even without correcting for multiple testing. Additionally, you will need to rely on the normality assumption. $\endgroup$
    – Michael M
    Commented Jun 27, 2020 at 5:49
  • 1
    $\begingroup$ Welcome to the site. Questions about how to do things in R (or any software) are off topic here. If you can edit your question to focus on the statistical issues, it may be reopened. $\endgroup$
    – Peter Flom
    Commented Jun 27, 2020 at 14:23

3 Answers 3

4
$\begingroup$

First of all, if you have only 3 + 2 samples in each group, you are quite inaccurate in estimating the standard error, and doing this 20000x t.test is most not likely not the best approach. If your data is something related to gene expression or biological data, my suggestion is to check out the R bioconductor package limma and also this paper.

If you absoluately want to do a t.test, below is a quick method, using a library and the p-values are approximate:

library(genefilter)
set.seed(111)
exampleDF <- data.frame(s1 = rnorm(10), s2 = rnorm(10), s3 = rnorm(10), s4 = rnorm(10), s5 = rnorm(10))
group = factor(rep(c("A","B"),c(3,2)))

res = rowttests(as.matrix(exampleDF),factor(group))
res$adjP = p.adjust(res$p.value,"BH")
head(res)
    statistic         dm    p.value      adjP
1  3.04099375  2.2855413 0.05582346 0.3261168
2  2.84786452  0.9011630 0.06522336 0.3261168
3  0.41773686  0.5554058 0.70423693 0.8802962
4 -0.09067738 -0.1196167 0.93346409 0.9804451
5  0.91684108  1.0797461 0.42683640 0.7113940
6 -0.91749882 -0.8714534 0.42654148 0.7113940

The default in rowttest assumes equal variance for groups. You have to see whether this is true. If this is not the case, you can go back to using t.test()

Then it will be:

library(broom)

res = apply(exampleDF,1,function(i)tidy(t.test(i ~ group)))
res = do.call(rbind,res)
res$adjP = p.adjust(res$p.value,"BH")

res[,c("statistic","p.value","adjP")]
# A tibble: 10 x 3
   statistic p.value  adjP
       <dbl>   <dbl> <dbl>
 1    2.33    0.248  0.826
 2    3.52    0.0515 0.515
 3    0.364   0.762  0.952
 4   -0.0897  0.936  0.976
 5    0.706   0.602  0.952
 6   -1.00    0.393  0.952
 7   -2.15    0.135  0.675
 8   -0.0341  0.976  0.976
 9   -0.983   0.488  0.952
10   -0.471   0.710  0.952
$\endgroup$
2
  • $\begingroup$ Thank you for the help. The rowttests() function is pretty much what I wanted. But what's the difference between the first and second method? Does the first method not give exact p-values? $\endgroup$ Commented Jun 27, 2020 at 15:13
  • 1
    $\begingroup$ Hi @ZuhaibAhmed, yeah sorry should have elaborated a bit. rowttest assumes equal variance, which is var.equal=TRUE in t.test(). You need to see whether this applies to your samples, although with n=3 and n=2.. i don't know honestly. $\endgroup$
    – StupidWolf
    Commented Jun 27, 2020 at 15:27
1
$\begingroup$

I suppose you mean that, in each row, A is a sample of size $n_a=30$ from $\mathsf{Norm}(0,1)$ and B is a sample of size $n_b=20$ from $\mathsf{Norm}(0,1).$ Then to test $H_0: \mu_A = \mu_B$ against $H_1: \mu_A \ne \mu_B$ at the 5% level, using a Welch 2-sample t test. And I suppose you will do this test for each of $20\,000$ rows. If the purpose is to see what proportion of the tests should lead to rejection, then the answer should be very nearly 5%.

If that is correct, each t test needs to stand on it's own. It's as if $20\,000$ different labs replicated the same 50-subject experiment.

I suppose your code and intent are equivalent to the following, in R:

set.seed(2020)
pv = replicate(20000, t.test(rnorm(30),rnorm(20))$p.val)
mean(pv <= .05)
[1] 0.0496

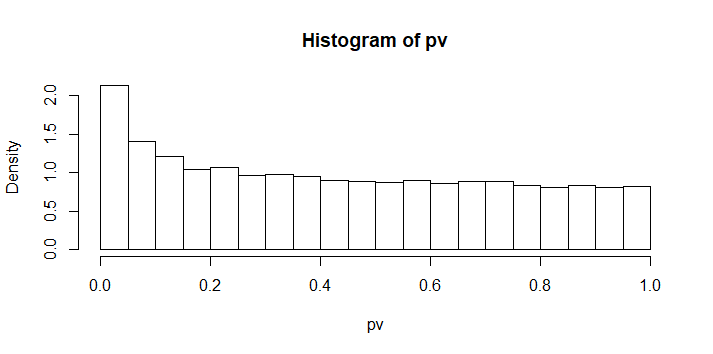
Your P-values should be uniformly distributed on $(0,1),$ where the rejecting 5% of test are represented in the left-most bar of the histogram below:

hist(pv, prob=T)

enter image description here

You could use a similar simulation to show that a polled t test, nominally at the 5% level, rejects at a higher than the intended rate, if the larger group has $\sigma_a=.5$ and the smaller group has $\sigma_b=2.$

set.seed(626)
pv = replicate(20000, t.test(rnorm(30,0,.5),rnorm(20,0,2), var.eq=T)$p.val)
mean(pv <= .05)
[1] 0.1068
hist(pv, prob=T)

enter image description here

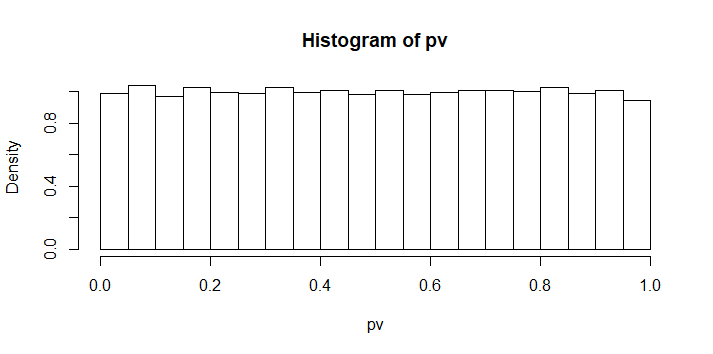
However, Welch t tests would accommodate to the unequal variances and reject nearly 5% of the time as intended.

set.seed(627)
pv = replicate(20000, t.test(rnorm(30,0,.5),rnorm(20,0,2))$p.val)
mean(pv <= .05)
[1] 0.05095

If you have something else in mind, please explain the purpose you have in mind. Why are you repeating the same test many times?

$\endgroup$
6
  • $\begingroup$ I'm sorry for not explaining clearer. My situation is that in my dataframe, each row represents a gene, and each column represents some property of that gene. So each gene has 5 properties. Three of them belong to one group and two of them to another group. What I'd like to do is go through each row (i.e. gene) and see if there's a difference between the two groups. And I'd like to determine which genes have this difference, by looking at the p-value. $\endgroup$ Commented Jun 27, 2020 at 15:18
  • $\begingroup$ Thanks for the update. Then for each row (gene) it might be best to do a one-way ANOVA and if significant make ad hoc comparisons within A, within B, between A and B. Within each gene, you'd need to use Bonferroni or some other method to protect against false discovery. Each gene can be considered separately. But you'd need to be aware that 5% of genes will show bogus effects. I would handle that by looking again carefully at 'significant' genes with several datasets on each. (Also, Bonferroni protection for 20,000 genes would have you working at level $.05/20000,$ which seems impractical.) $\endgroup$
    – BruceET
    Commented Jun 27, 2020 at 16:42
  • $\begingroup$ You'd have about 1000 potentially interesting genes. If diff btw A and B is of special interest, maybe look at ad hoc 'contrast' to make that comparison. Maybe follow up first on the ones signif diff btw A and B. Maybe next datasets on those genes will confirm effect to be real. Otherwise, although, P-value isn't everything, it may be an indication which genes are of real interest. No one would blame you for looking first at genes with lowest P-values. Or for using any other reasonable criterion for deciding which of the potential 1000 should be first for additional investigation. $\endgroup$
    – BruceET
    Commented Jun 27, 2020 at 17:08
  • $\begingroup$ Finally, with 20 observations in each of 5 groups you have a 90% chance of detecting differences in gene expression that are about 1.3 times the standard deviation of the population (which you have set at 1 in your simulation). So if not all of the means are 0 (as in your simulation), then genes with "something going on" at the $1.3\sigma$ level will likely show up in your massive screening of 20000 genes. Seems best to focus first on genes of interest for theoretical reasons, but a massive undirected screen as you propose may not be as futile as some assume. $\endgroup$
    – BruceET
    Commented Jun 27, 2020 at 17:33
  • $\begingroup$ Thank you for your input. This isn't really meant to be a thorough statistical analysis. I'm more using it for mining purposes. So I'm thinking just a simple multiple t-test should give some genes of interest. Then I can filter out the less interesting ones through other means. I appreciate your thorough response! $\endgroup$ Commented Jun 27, 2020 at 21:14
0
$\begingroup$

As per Michael M comment which seems correct, think you may need to alter your method. Below are some comments that I hope are helpful.

Performing a t-test on two of the columns would be more of a standard thing to do, from what I understand (please add comments if this is wrong) the t-test needs around 30 samples to achieve closeness to normality, which is needed to achieve the t-test assumptions. If the column is already normal (as in you R data code) then the normality assumption is met immediately, so you can do a t-test on fewer samples, probably around ten. If your data has 10,000 samples then a t-test will detect small differences, thus effect size will also be relevant.

The Holm-Bonferroni correction can be used to mitigate multiple comparisons, and this helps to reduce the type I error.

Because you mentioned a design matrix: The design matrix, also known as the regressor matrix is used in regression analysis. It is just the name of a matrix use in a regresssion context. If a regression is done, then t-tests are given in summary output showing whether the regrssion coefficients are statistically different from zero.

$\endgroup$
1
  • $\begingroup$ I'm sorry for not explaining clearer. My situation is that in my dataframe, each row represents a gene, and each column represents some property of that gene. So each gene has 5 properties. Three of them belong to one group and two of them to another group. What I'd like to do is go through each row (i.e. gene) and see if there's a difference between the two groups. And I'd like to determine which genes have this difference, by looking at the p-value. So I can't compare 30 samples unfortunately. I only have 3 in one group and 2 in another group, and I want to compare those groups for each gene $\endgroup$ Commented Jun 27, 2020 at 15:20

Your Answer

By clicking “Post Your Answer”, you agree to our terms of service and acknowledge you have read our privacy policy.

Not the answer you're looking for? Browse other questions tagged or ask your own question.