6
$\begingroup$

I am experimenting with bootstrapping and correlation coefficients, and I'm facing an unexpected behavior.

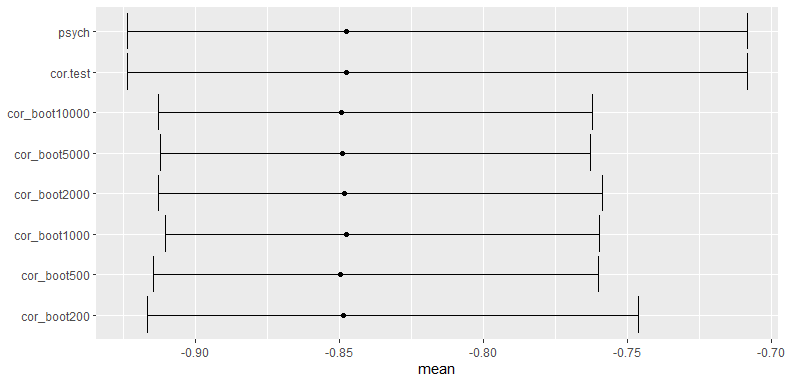
The confidence interval I'm calculating is not equivalent to the one calculated by the standard function (stats::cor.test in R).

Indeed, the bootstrap interval is narrower, and increasing the number of bootstraps does not correct this difference.

Is this an expected result? In this case, is there a way to correct it?

R code for bootstrap simulation:

First, I declare a function that takes 2 vectors, put them in a data.frame, and then replicate B times the process "take N couples of values from those vectors (with replacement) and calculate the correlation".

cor_boot1 = function(x, y, B=200){
    dat = data.frame(x=x, y=y)
    N = nrow(dat)
    replicate(B, {
        idx = sample.int(N, N, replace = TRUE) 
        cor(dat[idx, 1], dat[idx, 2])
    })
}

Then, I take 2 numerical vectors from the mtcars dataset and calculate the correlation along with the confidence interval using standard functions (cor.test and psych::corr.test).

x=mtcars$mpg
y=mtcars$disp    

ct=cor.test(x,y)
ct$estimate # -0.8475514
ct$conf.int # -0.9233594 -0.7081376

ct2=psych::corr.test(x,y) 

Now, I set the seed for reproducibility and calculate the correlation and intervals using my bootstrapping function for several values of B.

set.seed(0)
l = list(
    cor_boot200=cor_boot1(x,y, 200),
    cor_boot500=cor_boot1(x,y, 500),
    cor_boot1000=cor_boot1(x,y, 1000),
    cor_boot2000=cor_boot1(x,y, 2000),
    cor_boot5000=cor_boot1(x,y, 5000),
    cor_boot10000=cor_boot1(x,y, 10000)
) 

Ultimately, for each result, I get the mean and the 2.5% and 97.5% quantiles (which are supposed to be the confidence interval bounds) of the bootstrap results. This allows comparing the results of standard functions and bootstrapping.

library(tidyverse)
rslt = tibble(name=names(l), 
              mean=map_dbl(l, mean), 
              # se=map_dbl(l, sd), 
              # conf_i=ct$estimate-1.96*se, #saw this somewhere, obviously even worse
              # conf_s=ct$estimate+1.96*se, 
              conf_i=map_dbl(l, ~quantile(.x, probs=c(0.025, 0.975))[1]), 
              conf_s=map_dbl(l, ~quantile(.x, probs=c(0.025, 0.975))[2])) %>% 
  rbind(
    c(name="cor.test", se=0, mean=ct$estimate, conf_i=ct$conf.int[1], conf_s=ct$conf.int[2]),
    c(name="psych", se=0, mean=ct2$r, conf_i=ct2$ci[["lower"]], conf_s=ct2$ci[["upper"]])
  ) %>% 
  mutate(name=as_factor(name), across(c("mean", "conf_i", "conf_s"), as.numeric))
  name            mean conf_i conf_s
  <fct>          <dbl>  <dbl>  <dbl>
1 cor_boot200   -0.849 -0.909 -0.773
2 cor_boot500   -0.845 -0.914 -0.746
3 cor_boot1000  -0.847 -0.912 -0.755
4 cor_boot2000  -0.849 -0.910 -0.761
5 cor_boot5000  -0.848 -0.912 -0.761
6 cor_boot10000 -0.849 -0.913 -0.762
7 cor.test      -0.848 -0.923 -0.708
8 psych         -0.848 -0.923 -0.708

Here is the plot where the point represents the mean and the whiskers represent the quantiles:

ggplot(rslt, aes(x=name, y=mean, ymin=conf_i, ymax=conf_s))+
  geom_errorbar() + geom_point() + coord_flip() + xlab(NULL)

correlation plot x1

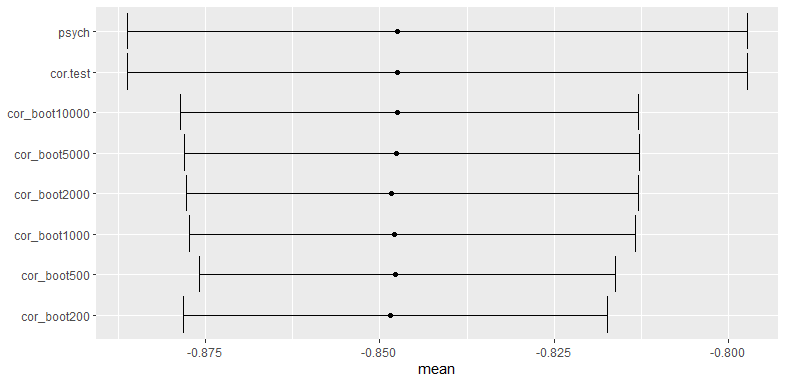
Here is the same plot with a 5-fold larger input:

x=rep(mtcars$mpg, 5)
y=rep(mtcars$disp, 5)

correlation plot x5

$\endgroup$
8
  • $\begingroup$ Please write your question in a way that does not require people to understand your code or guess your intentions. In particular, please explain what the different lines in your plots represent and what your underlying data and model are. $\endgroup$
    – whuber
    Commented Jul 14, 2020 at 13:32
  • $\begingroup$ @whuber I added an r tag, as this question may be a bit dependant on the statistical behavior of R itself (the tag description fits perfectly to the question). I will try to explain my code with comments but I'm afraid that knowing R might be somehow mandatory to answer this question. Still, this is not a programming question at all and I really think that it belongs here on SSE. $\endgroup$ Commented Jul 14, 2020 at 13:55
  • $\begingroup$ I agree that it doesn't seem to be a programming question. I am primarily concerned (therefore) with ensuring that the question is understandable even by people not conversant with R and the R packages you are employing. $\endgroup$
    – whuber
    Commented Jul 14, 2020 at 16:14
  • $\begingroup$ @whuber is that OK for you after my edit? $\endgroup$ Commented Jul 15, 2020 at 6:58
  • 1
    $\begingroup$ @StupidWolf thanks for the suggestion, I added the table $\endgroup$ Commented Jul 15, 2020 at 9:42

2 Answers 2

4
$\begingroup$

Neither method of estimating confidence intervals (CI) will work well on these data, so it's not surprising that they disagree. The problem is that the nominal values of CI don't always correspond to the actual CI coverage when underlying assumptions don't hold. In such cases nominal 95% CI might actually cover the true value more frequently or less frequently than that, sometimes by surprisingly large amounts.

First, the Fisher transformation used for estimating CI in the standard tests is based on the assumption that the 2 variables have a joint bivariate normal distribution. A quick look at the mtcars data should disabuse you of that notion; both the mpg and the disp values appear bimodal (associated with 4- versus 8-cylinder cars) and the joint plot is concave. So you can't count on the Fisher transformation to provide correct coverage.

Second, the type of bootstrap that you use, simply taking the 2.5th and 97.5th percentiles among estimates from bootstrapped samples, also can't always provide correct coverage. This is a problem when the quantity being calculated from the data isn't pivotal, a problem recognized since the beginning of bootstrapping.

The probability distribution of a pivotal quantity is not a function of unknown parameters. In this case, the correlation coefficient is unknown, to be estimated from the data. The sampling distribution with bivariate normal data around a true correlation coefficient of 0 will be nicely symmetric, but as the true correlation coefficient approaches the limits of +1 and -1 (as in these sample data) the center of the sampling distribution necessarily changes and the distribution becomes more and more asymmetric as the limits are reached. The correlation coefficient isn't pivotal, so the type of analysis you used on the bootstrapped samples can't be counted on to provide correct coverage.

For the correlation coefficient, this problem with nonnormal data has been explored extensively via simulations by Bishara and Hittner (Behav. Res. 49: 294-309, 2017). They examined 11 different types of CI estimates, and provide R code for the methods in a supplement. They conclude that "Only the Spearman rank-order and RIN [rank-based inverse normal] transformation methods were universally robust to nonnormality."

This page provides an introduction to different ways to get CI from bootstrapping. I would recommend using the boot package in R and its boot() and boot.ci() functions in your further explorations of bootstrapping confidence intervals, as they directly provide 4 different estimates.

$\endgroup$
3
$\begingroup$

The two methods are different with their pros and cons.

Assumptions (valid for both): (here)

  • Pearson's correlation assumes that data $X$ and $Y$ are normally distributed.
  • linear relationship between $X$ and $Y$

Confidence intervals (analytical method psych and cor.test):
Fisher $r$-to-$z$ transformation is applied to the correlations $r$

$$ z=0.5*\ln\left(\frac{1+r}{1-r}\right) $$

which approximately follows a Normal distribution with standard error $SE=\frac{1}{\sqrt{n-3}}$, where $n$ is the sample size. Then the confidence intervals can be obtained from the critical values of the standard normal $N(0,1)$:

$$ CI_{0.95}^{(z)}=(z-SE*1.96, z+SE*1.96) $$

Inverting the expression of $z$ in terms of $r$ we can derive the CI for $r$.

"Confidence" intervals (bootstrapping):
No assumptions on the underlying distribution of (transformed) Pearson's correlation values. This is estimated from the data by resampling with replicates. The confidence intervals are directly estimated from the quantiles of the empirical distribution.

Analytical method:
Pros:

  • Quick
  • Good approximation for large sample size

Cons:

  • Assumptions may be not valid if sample size is small
  • Sometimes it's impossible to derive the analytical distribution

Bootstrapping:
Pros:

  • No assumptions on the distribution of Pearson's correlation

Cons:

  • Computationally expensive
  • Its estimate is accurate only if the dataset captures enough of the population

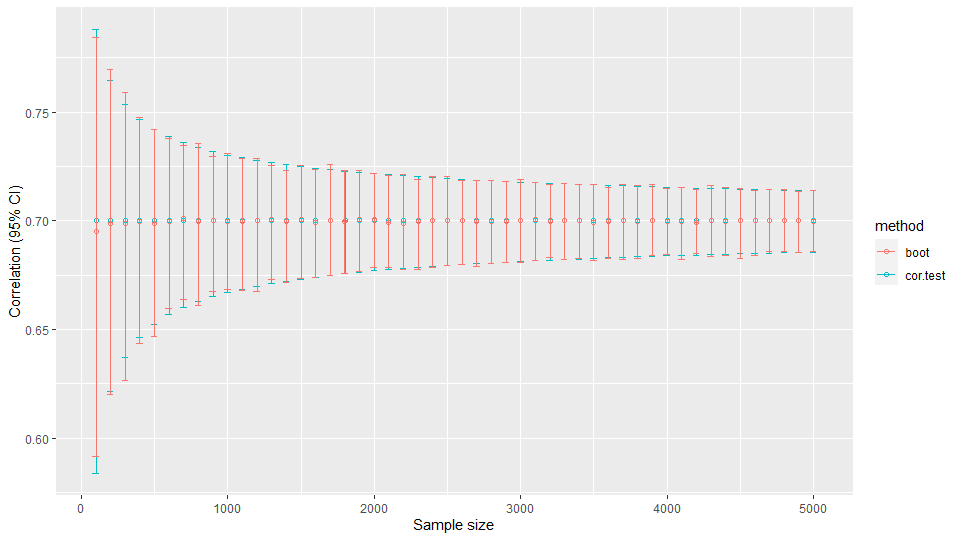
Here some simulations:

library(MASS)
library(magrittr)
library(tidyr)
#> 
#> Attaching package: 'tidyr'
#> The following object is masked from 'package:magrittr':
#> 
#>     extract
library(ggplot2)

# Uncorrelated random variables
sig <- diag(1, 2, 2)
x <- mvrnorm(n=100, mu=c(0, 0), Sigma=sig, empirical=TRUE)

(r0 <- cor.test(x[, 1], x[, 2]))
#> 
#>  Pearson's product-moment correlation
#> 
#> data:  x[, 1] and x[, 2]
#> t = -3.1142e-15, df = 98, p-value = 1
#> alternative hypothesis: true correlation is not equal to 0
#> 95 percent confidence interval:
#>  -0.1964181  0.1964181
#> sample estimates:
#>           cor 
#> -3.145774e-16

# Num bootstrapping draws
N <- 1000
r_boot <- numeric(N)
for (i in 1:N) {
  ind <- sample(nrow(x), nrow(x), replace=TRUE)
  r_boot[i] <- cor(x[ind, 1], x[ind, 2])
}

# 95% "confidence" interval
quantile(r_boot, probs=c(0.025, 0.975))
#>       2.5%      97.5% 
#> -0.1980896  0.1971029

# Test difference CI depending on the sample size
M <- seq(100, 5000, 100)
ci0 <- matrix(NA, length(M), 2)
ciboot <- matrix(NA, length(M), 2)
r0 <- rboot <- numeric(length(M))
for (i in 1:length(M)) {
  # Generate two samples with correlation r=0.7
  sig <- rbind(c(1, 0.7), c(0.7, 1))
  x <- mvrnorm(n=M[i], mu=c(0, 0), Sigma=sig, empirical=TRUE)
  
  # Analytical method
  res <- cor.test(x[,1], x[,2])
  ci0[i, ] <- res$conf.int
  r0[i] <- res$estimate
  
  # Bootstrapping
  N <- 1000
  r_boot <- numeric(N)
  for (j in 1:N) {
    ind <- sample(nrow(x), nrow(x), replace=TRUE)
    r_boot[j] <- cor(x[ind, 1], x[ind, 2])
  }
  rboot[i] <- mean(r_boot)
  ciboot[i,] <- quantile(r_boot, probs=c(0.025, 0.975))
}
# Plot the difference between the two methods
rbind(tibble(M=M, r=r0, ci_lo=ci0[,1], ci_up=ci0[,2], method="cor.test"),
      tibble(M=M, r=rboot, ci_lo=ciboot[,1], ci_up=ciboot[,2], method="boot")) %>%
ggplot(aes(x=M, y=r, ymin=ci_lo, ymax=ci_up, color=method)) +
  geom_point(position=position_dodge(0.3), shape=21) +
  geom_errorbar(position=position_dodge(0.3)) +
  xlab("Sample size") + ylab("Correlation (95% CI)")

As you can see, the largest differences are visible with smaller sample sizes, although they are statistically indistinguishable

enter image description here

$\endgroup$
2
  • 2
    $\begingroup$ Do you have sources you can quote for those parametric assumptions (1) and (2) about correlation? AFAIK they are unusual but might make sense for testing the null hypothesis that the correlation is zero. I think you might be confusing the test statistic with the Pearson correlation coefficient. $\endgroup$
    – whuber
    Commented Jul 15, 2020 at 13:54
  • $\begingroup$ you are right. i fixed the answer. can you please check everything looks alright? $\endgroup$
    – user289381
    Commented Jul 15, 2020 at 14:20

Your Answer

By clicking “Post Your Answer”, you agree to our terms of service and acknowledge you have read our privacy policy.

Not the answer you're looking for? Browse other questions tagged or ask your own question.