1
$\begingroup$

Suppose that I have info about a sample, and

In one University, we have 70% females in the population and 30% males. In another University, the numbers are interchanged and 30% are females and 70% are males. Now assume that a random sample of 100 students are picked from each university (total number of observations: 200).

What is the probability that a sample of this size would be able to reject the null hypothesis that the proportion of females in the first population is greater than the second population at an alpha level of 0.05?

How do you find probability of sample and say that it rejects null hypothesis?

$\endgroup$
3
  • $\begingroup$ Are you interested in how to do this calculation or in a tool that would do it for you? $\endgroup$
    – dimitriy
    Jul 22, 2020 at 20:04
  • $\begingroup$ Hi @DimitriyV.Masterov I am interested in the calculation! $\endgroup$
    – afternoon
    Jul 22, 2020 at 21:13
  • 3
    $\begingroup$ You need to do a power calculation for a one-sided two sample proportion test given your population rates and sample sizes. Power is 1 - Type 2 error rate, which is the quantity you care about here. $\endgroup$
    – dimitriy
    Jul 22, 2020 at 21:39

1 Answer 1

1
$\begingroup$

Suppose I take Success to mean Female. Then the number of Females in a random sample from University A is $X \sim \mathsf{Binom}(n=100,p=0.7)$ and the number of Females in a random sample from University B is $Y \sim \mathsf{Binom}(n=100,p=0.3).$

Try one test. Let's try using prop.test in R to analyze one such experiment with 200 students:

set.seed(2020)
x = rbinom(1, 100, .7);  y = rbinom(1, 100, .3)
 x; y
[1] 68
[1] 32
prop.test(c(x,y),c(100,100), cor=F)

        2-sample test for equality of proportions 
              without continuity correction

data:  c(x, y) out of c(100, 100)
X-squared = 25.92, df = 1, p-value = 3.559e-07
alternative hypothesis: two.sided
95 percent confidence interval:
 0.2307018 0.4892982
sample estimates:
prop 1 prop 2 
  0.68   0.32 

So in this particular experiment, the test finds very strong evidence to reject $H_0: p_a = p_b$ with P-value very near $0.$ [Use of a continuity correction is not useful for samples of size 100, so I used parameter cor=F in prop.test to disallow continuity correction.]

Then the question is whether I somehow got an outrageously atypical pair of samples in the example above, or whether prop.test really does have good power to detect the large difference in the proportions of Female students at the two universities, based on samples of $n_a = n_b = 100$ from each university.

Simulate 100,000 tests to estimate power. By doing the experiment 100,000 times, I can closely estimate the power of this test. [Computations in R.]

set.seed(722)
pv = replicate(10^5, prop.test(c(rbinom(1,100,.3),
                                 rbinom(1,100,.7)), c(100,100),cor=F)$p.val)
mean(pv <= .05)
[1] 0.99996

The answer is that the power of the test to detect the difference in proportions (at the 5% level) is above 99%. So it would be extremely rare for such an experiment not to show a difference in proportions. Specifically, the answer is 'a probability of almost 1'.

There are several versions of this test (depending on whether a normal approximation is involved, whether a continuity correction is used, and whether the test uses a 'pooled' standard error (under the null hypothesis that proportions are equal). Not knowing the version of the test you will use, I can't give an algebraic solution. (Also, this is a 'self-study' problem and you have not shown what you have tried, so I have no way to guess what approach you might be planning/expected to use.)

Lower bound on power. Here is one possible approach that does not use simulation: If we have $X=60, Y=40,$ then prop.test rejects, so it will also reject for more extreme differences such as $X=61, Y=39,$ and so on. [You might use your favorite test here instead of R's implementation of prop.test.]

prop.test(c(40,60), c(100,100), cor=F)$p.val
[1] 0.004677735

However the exact binomial probability of $P(X \ge 60, Y \le 40) = P(X \ge 50)P(Y \le 40) = 0.9875.$ So that gives a pretty good idea that rejection is nearly certain.

pbinom(40, 100, .3)*(1-pbinom(40, 100, .7))
[1] 0.9875016

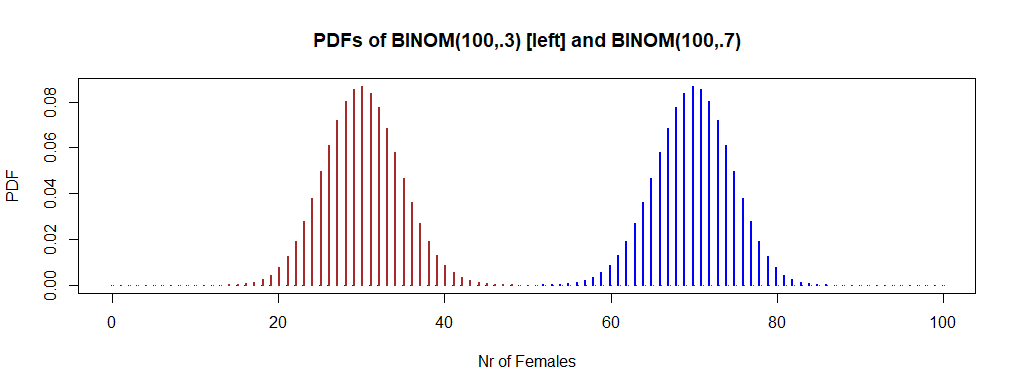
The plot below shows that PDFs of $\mathsf{Binom}(100, 0.3)$ and $\mathsf{Binom}(100, 0.7)$ hardly overlap.
enter image description here

x = 0:100;  pdf.x = dbinom(x, 100, .7)
y = 0:100;  pdf.y = dbinom(y, 100, .3)
hdr="PDFs of BINOM(100,.3) [left] and BINOM(100,.7)"
plot(x-.1, pdf.x, type="h", col="blue", lwd=2, 
     ylab="PDF", xlab="Nr of Females", main=hdr)
  points(y+.1, pdf.y, type="h", col="brown", lwd=2)

Addendum, per Comment: The answer is about 12% power.

set.seed(723)
pv = replicate(10^5, prop.test(c(rbinom(1,100,.48),
                                 rbinom(1,100,.53)), c(100,100),cor=F)$p.val)
mean(pv <= .05)
[1] 0.11845
$\endgroup$
11
  • $\begingroup$ This was really helpful, but I am not sure how would I approach the problem if numbers changed. This is confusing for a beginner, I could solve this question now, but it got messed up: 52% of the population are males, and 48% are female. In another University, 47% are male, and 53% are females. Suppose that a random sample of 100 people are picked from each University (total observations: 200). What is probability that sample of this size would be able to reject null hypothesis that proportion of males in first population are greater than the second population at an alpha level of 0.05? $\endgroup$
    – afternoon
    Jul 22, 2020 at 22:48
  • $\begingroup$ I suppose you can guess that the power will be low distinguishing btw $p=.48$ and $p=.53.$ What is puzzling me is why you have not already modified my simulation to approximate the answer. See addendum. // Once again, without knowing exactly what test you plan to use, it is not possible to give an algebraic formula for power. Even then (depending on the test), a formula may be messy. $\endgroup$
    – BruceET
    Jul 22, 2020 at 23:45
  • $\begingroup$ I have no experience of the approach you used above, that is the reason it is complicated for me $\endgroup$
    – afternoon
    Jul 23, 2020 at 2:27
  • $\begingroup$ Not sure about your interests. If you've never seen R before, I can understand it all looks strange. But if you're going to have much contact with probability and statistics, R can be a huge help. Free. Easy to download from www.r-project.org. Versions for Windows, Mac, Unix. Start out using it in the obvious way instead of cell phone calculator. Learn only the bits of immediate use. Lots of online help. Mostly well written. // Maybe you can look at code for 2 power computations in my Ans. Compare. How did I get from 1st to 2nd? // Waaay too much to try to learn all of R. (Nobody ever has.) $\endgroup$
    – BruceET
    Jul 23, 2020 at 5:36
  • $\begingroup$ Do you think you can once again explain the steps with the above question I posted in comments, maybe the more I look at solved problems the more I understand? $\endgroup$
    – afternoon
    Jul 23, 2020 at 20:14

Your Answer

By clicking “Post Your Answer”, you agree to our terms of service and acknowledge you have read our privacy policy.

Not the answer you're looking for? Browse other questions tagged or ask your own question.