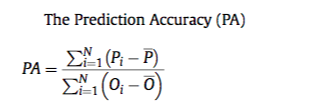
I'll be honest. This KPI is utter crap. And I would have written the same over my name if I had been a reviewer for the paper.
The denominator $\sum_{i=1}^N(O_i-\bar{O})$ does not depend on the predictions, so it's just a normalizing factor. Let's leave it aside for now.
The numerator $\sum_{i=1}^N(P_i-\bar{P})$ is... well, it's nothing at all, beyond being the average difference between the predictions and the average prediction. So you could call it a kind of Mean Error... but "Error" typically indicates some kind of relationship between the predictions and the actuals, and there is no such relationship here - it's an "error" between the predictions and the average prediction. Why anyone would be interested in this quantity is beyond me.
Now, if we simply scale each $P_i$ by a constant $\alpha\in\mathbb{R}$, then we scale $\bar{P}$, therefore the entire numerator, and therefore $PA$, by the same $\alpha$. So we can make $PA$ as large or as small (even negative) as we want. There is still no relationship between $\alpha PA$ and any kind of prediction accuracy. In particular, there is no reason at all to claim that "a higher accuracy is given by a value closer to 1" (section 3.6 in the paper). (Actually, since there is so utterly no connection between $PA$ and a value 1, I slightly suspect that the authors actually used some other formula, and that their equation (6) reflects something else than the $PA$ they report.)
The authors' confusion may stem from the fact that if $P_i=O_i$ for all $i$, then yes, $PA=1$. But we want to argue the other way around: if $PA=1$, then the predictions are "good" in some way, $P_i\approx O_i$. And that simply doesn't follow. It might as well be that $P_i=O_i+K$ for some constant $K\in\mathbb{R}$, which again yields $PA=1$, but we hopefully wouldn't call all predictions equally "good" that differed from the observations by some (possibly large) offset. Or the predictions might be equal to the observations - but permuted randomly, $P_i=O_{\pi(i)}$ for some random permutation $\pi$. This would again yield $PA=1$, but would hopefully not be considered a good prediction.
Bottom line: disregard $PA$ completely, and definitely don't use this in any follow-up work. Concentrate on the more reasonable error measures they also use, like the $NAE$ and the $RMSE$. (Actually, it makes no sense to use both error measures to evaluate the same point prediction, per Kolassa, 2020, IJF. Yes, that's me.)

