1
$\begingroup$

I have a time series with nonstationary data. Looking at the plot of the data it is clear that there are structural breaks. As data follow the stochastic process, I want to build Markov Switching Model, and due to nonstationary data, Markov trend is needed.

I want to implement the following model:

$$ y_t = (\alpha_0 t + \alpha_1 \sum_{i=1}^t s_i) + \beta_1 y_{t-1} + ... + \beta_k y_{t-k} + \sum_{i=1}^t \epsilon_t $$

which is introduced in this article.

However, this article is the only reference I have about Markov trend. Also, I don't really know how to start the implementation. Usually, I use MSwM R-package, but it doesn't contain Markov trend.

Does anybody have other references for Markov trend in Markov Switching Model? Even better would be any tips on how to implement the model. For me, the most problematic part is what to do with $s_i$ as it should be determined by the model - as far as I understand...

$\endgroup$

1 Answer 1

0
$\begingroup$

This ressource lists most of the R packages available for change point analyses. A good handful of them can model AR(N) models which is a Markov process.

In the AR(N) literature the term "non-stationary" is a bit ambiguous meaning either

  1. Autoregressive coefficients can exceed the interval [-1, 1]. I think only the mcp package can do this, and you'd need to set priors explicitly since the default priors are stationary.
  2. The autoregressive coefficients are in [-1, 1] on top of a non-intercept-only regression model. mcp and segmented can do this, though segmented requires the segments to be joined at the change points.

Here is an example using mcp:

remotes::install_github("lindeloev/mcp")  # Because mcp_example() is in the dev version as of writing this
library(mcp)
ex = mcp_example("ar")  # Get a demo dataset. See ex$data

# Set up a model
model = list(
    price ~ 1 + ar(2),  # segment 1: stationary AR(2)
    ~ 0 + time + ar(1)  # segment 2: AR(1) on a joined slope
}
fit = mcp(model, ex$data)

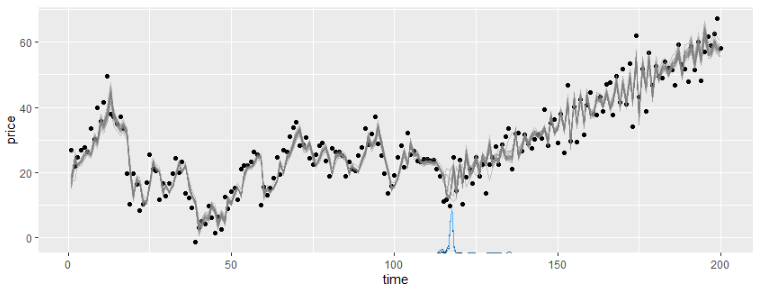
Now it's just a matter of plotting (plot(fit), plot_pars(fit)), summarizing (summary(fit), fixef(fit)), predicting (fitted(fit), predict(fit)) etc. Here's a plot:

enter image description here

$\endgroup$
2
  • $\begingroup$ I am still studying what you've proposed. However, I can not replicate your example, due to Error in mcp_example("ar") : could not find function "mcp_example" even though I've installed mcp library. $\endgroup$
    – Vesnič
    Commented Sep 7, 2020 at 6:49
  • $\begingroup$ Ah, sorry, that's because mcp_example is in the development version. Run remotes::install_github("lindeloev/mcp") $\endgroup$ Commented Sep 7, 2020 at 22:55

Your Answer

By clicking “Post Your Answer”, you agree to our terms of service and acknowledge you have read our privacy policy.

Not the answer you're looking for? Browse other questions tagged or ask your own question.