TL;DR: to compare different neural network configurations that could have generated the observed training dataset
Before talking about neural networks (NNs) let's interpret what the likelihood tells us.
For any dataset $\mathcal D=\{x_n\}_n$ of observed variables with an associated probability distribution $p$, i.e., $x_n\sim p({\boldsymbol \theta})$ (where $\boldsymbol\theta$ are the parameters that govern our distribution $p$), we can think of the likelihood of $p$ as a value that tells how how true it is, in terms of the observed data, that a given vector $\boldsymbol{\hat\theta}$ generated the observed variables.
Mathematically, we define the likelihood function as the joint probability of the observed variables given the parameters of the distribution, and we usually assume that the observed variables are independent and identically distributed (i.i.d), i.e.,
$$
p(x_1, \ldots, x_N\vert{\boldsymbol\theta}) = \prod_{n=1}^Np(x_n\vert\boldsymbol\theta)
$$
Before moving on with NNs, let us consider an example to illustrate this point.
Consider the following dataset with Bernoulli-distributed random variables: D = [1, 1, 1, 1, 0, 1, 1, 1]. Since the probability mass function (pmf) of a bernoulli-distributed random variable is given by
$$
p(x\vert\mu) = \mu^x (1 - \mu)^{1-x},
$$
we can see that our likelihood will take the form
$$
\mathcal L = \prod_{n=1}^8 p(x_n\vert\mu) = \mu^{\sum_{n=1}^8x_n} (1 - \mu)^{N - \sum_{n=1}^8x_n}
$$
Coming back to your analogy of what the likelihood tells us, we would like to find the parameter $\mu$ that is more likely to have generated the dataset D. The bigger $\mathcal L$ is, the more likely is that that a given $\mu$ generated D.
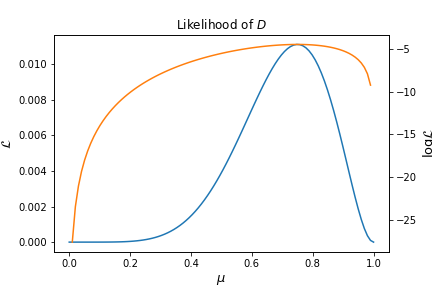
Since we know that $\mu$ can only take values from $0$ to $1$, we can expect $\mathcal L$ to be bigger for values around 1, than for values around 0, and indeed this is the case as we can see from the following graph:

Since the likelihood is the product of many probabilities. In many cases, these probabilities tend quickly to zero, which makes them computationally impossible to work with. To counter this, we can introduce the log-likelihood so that we sum over log-probabilities. Since the log-transformation of a function does not change where its maximum value is in its domain, the maximum log-likelihood will not yield a different value of where the maximum value of $\mu$ is.
If we wish to find where the maximum value of $\mu$ is, we can simply take the derivative of the log-likelihood with respect to $\mu$, set it to zero and solve (hint: the answer will be the sample mean). Furthermore, since
$$
\hat x = \arg\max_x f(x) = \arg\min_x -f(x)
$$
we can see that finding where the maximum log-likelihood happens is the same as finding where the minimum negative log-likelihood happens (the more negative, the better it is)
Introducing neural networks
What does a NN has to do with any of this? Consider a database $\mathcal{D}=\{(t_n, {\bf x}_n)\vert t_n\in\mathbb{R}, \mathcal{x}_n\in\mathbb{R}^M\}_{n=1}^N$ and a neural network architecture of the form $f: \mathbb{R}^M\to\mathbb{R}$ (it can be a feed-forward NN, convolutional NN, RNN, or any neural network architecture that returns a single real number). We assume that
$$
t_n\vert{\bf x}_n \sim \mathcal{N}(t_n \vert f({\bf x}_n, W), \sigma^2)
$$
where $W$ are the weights of the neural network.
If we assume that we have trained $K$ configurations of NNs, we can look for the best (in terms of the training dataset) NN by comparing their likelihoods or, equivalently, their negative log-likelihoods, as they will tell us how likely is each configuration to have generated the observed training dataset.

