I have a question about the mathematical details of Ridge Regression and I have not been able to find a detailed explanation. For what I know the ridge regression is a penalty term that is used to penalize the parameters of a linear regression model (for example the weights in a linear model). So I always have seen the following equation (1):
and I found that the formula above originates from a algebraic formulation of the following optimization problem, equation (2):

I have read some material in which it says the equation 1 refers to the cost obtained from adding the RSS and the penalization of the weights.
The problem that I have is how can I transform from equation 2 to equation 1?
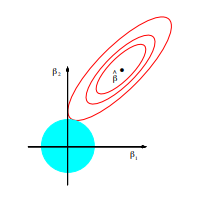
Also, and for not creating another thread, I have found this figure to explain Ridge regression:
and the explanation given is that the contour plots represents values of beta with equal RSS (likelihood) and that ridge regression pushes this contour plot to touch the inner blue ball that is in the center of the coordinates. At this point, I get lost, what does really the bull ball represents in this graph and why it says (in the readings I found) that the best value is within the blue circle?
Thank you for your help and sorry for any misinterpretation that I might have in this question.


