2
$\begingroup$

I am pretty new to the topic of time series analysis and I am trying to use the package "forecast" on daily temperature data to predict the daily temperature in the future. To be precise, I just need one day after the given time series. My data looks like this:

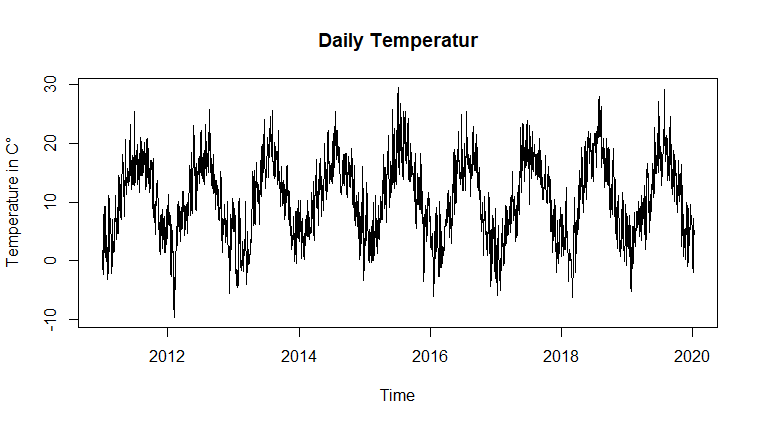
enter image description here

As you can see there is seasonality in the dataset, every 365 days the cycle repeats. Additionally, there is no trend, so the mean and variance stays approximately the same throughout the cycles. From what I can see I need a approach for a seasonal time series without a trend. I already tried to do that with a Seasonal decomposition and then an ARIMA and a SARIMA model. Here is my code:

x<-ts(dataset,start = c(2011,1,1),end = c(2020,8,31),frequency = 365)
pred<-stlf(x,h=1,method="arima") 

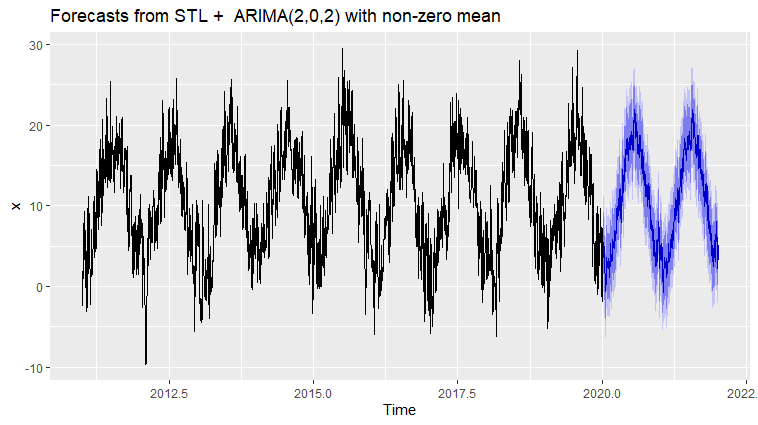
Just to show how good it fits I visualized the model for two following years with

stlf(x,h=2*365,method="arima") %>%
  autoplot()

enter image description here

That is not a bad fit but it is not precise enough for my purpose. so I tried to fit a SARIMA model. First of all I try to get the optimal parameters for the SARIMA model with the auto.arima() function. The problem is that it takes very long to calculate and I am not sure if this is the right approach. I wanted to continue with the parameters put in the samira.for() function and predict the future values afterwards.

fit<-auto.arima(x)

Maybe you guys could help me find the right approach. What could I change or is this even the right way to do it for my purpose? It was difficult for me to create a reproducible example but maybe you can also help me like that.

Thanks in advance!

$\endgroup$
2
  • 1
    $\begingroup$ ts class does not support dates. start= should be a 2 element vector with the year as the first element and a number between 1 and 365 as the second number representing the day of the year of the start if the frequency of the series is 365. end= is not needed if start is specified. Remove one day in each leap year such as Feb 29 or Dec 31 if you want this to correspond to year and day of the year. $\endgroup$ Commented Oct 6, 2020 at 19:57
  • $\begingroup$ Thanks for your answer! I changed my time series to inds <- seq(as.Date("2011-01-01"), as.Date("2020-08-31"), by = "day") new_x<-ts(dataset,frequency = 365,start = c(2011,as.numeric(format(inds[1], "%j")))) . This should do it $\endgroup$
    – veka
    Commented Oct 7, 2020 at 6:55

1 Answer 1

2
$\begingroup$

ARIMA takes a long time to fit for time series with "long" seasonal cycles. It is good for quarterly data (4 periods to a cycle) or monthly data (12 periods to a cycle) - but as you found, it struggles with daily data and yearly seasonality (365.25 periods to a cycle).

An STL forecast is already a very good approach, and I would consider it a useful benchmark. It is a common finding in time series forecasting that very simple benchmarks are often surprisingly hard to improve on.

One potential approach would be to use harmonics as predictors, with periods equal to the length of a year (and half a year, and a third, ...). Feed these into the xreg parameter of auto.arima() to run a regression with ARIMA errors.

That is not a bad fit but it is not precise enough for my purpose.

Sometimes our requirements on forecast accuracy are simply too high and cannot be met. If my purpose is to win big at roulette, then a hit probability of 1/37 is also not precise enough - but there is nothing I can do about it. You may find How to know that your machine learning problem is hopeless? amusing reading. At some point, it is more useful to invest resources in mitigation of unavoidable forecast errors, rather than in pursuing higher accuracy.

$\endgroup$
1
  • $\begingroup$ Thanks for this useful answer! I also tried the approach with the harmonics as predictors which turned out to be not that great but I am not sure if I conducted this approach correctly. I will edit my answer and but this approach in it, so maybe you could help me there as well. I give myself some more time trying to improve the precision but maybe you're right and I have already the best and at the same time the most simple model. So thanks again! $\endgroup$
    – veka
    Commented Oct 7, 2020 at 7:06

Your Answer

By clicking “Post Your Answer”, you agree to our terms of service and acknowledge you have read our privacy policy.

Not the answer you're looking for? Browse other questions tagged or ask your own question.