4
$\begingroup$

I'm working at a distribution centre for medical devices and in the last few months I have been busy with making a forecast model that has accurate forecasts. Due the pandemic, the number of units shipped were very low in the months March, April, May and June (4 months). The time series shows an upwards until the COVID-19 impact hit and is since July back on track on the upwards trend. Due to organization policy I could not show the real graph of the trend so I've drawn one that looks like it to make the situation more clear. See the picture below. enter image description here
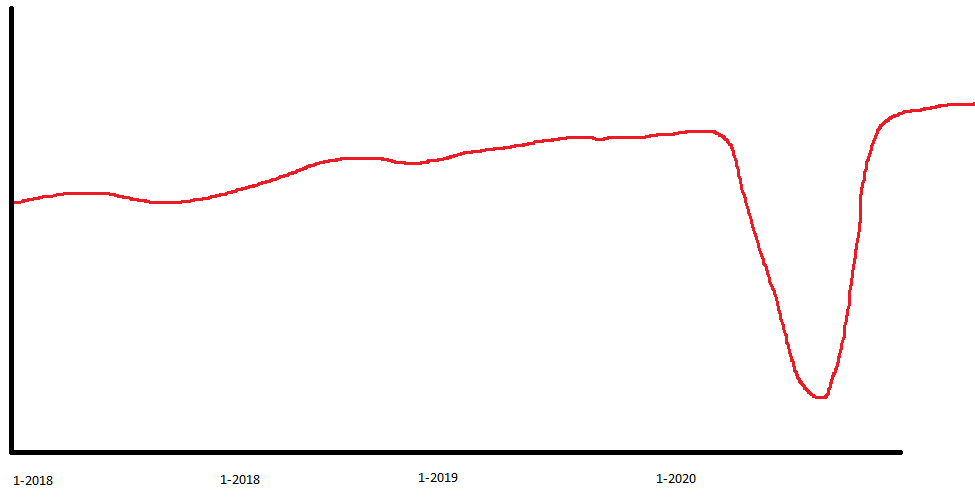
This dent in the upwards trend distorts my forecast from my ARIMA model. At the moment i'm doing research on how to deal with this portion of the time series dataset that is impacted by COVID-19.

In the following article, https://towardsdatascience.com/top-3-methods-to-minimize-covid-19-impact-on-data-science-part-2-5475c5ee1ab9, I came across a few approaches to deal with the problem:

1. Drop the data that is impacted by COVID-19. (For me not ideal because it means I have to drop 10% of my dataset and the my noob knowledge on time series forecasting you cant have gaps in your dataset?)

2. Replace the dataset that is impacted by COVID-19 with forecast values of that period. (Pretty valid solution in my situation: forecast is pretty accurate before COVID-19 and this will ensure that the upwards trend in the time series continues.

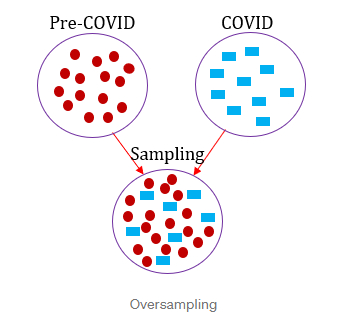
3. Oversampling: letting the data that is impacted by COVID-19 stay as it is and use oversampling to make the data that is valid have a bigger role in training the model than the data that is impacted by COVID-19. (Possible approach in my situation but not sure how to do it and what the downsides are of oversampling)

Oversampling

Is there anyone else with the same problem? What approach would you advice? What is your opinion on the 3 approaches? Anyone else that knows different approaches or articles on this topic? Please share, I will be very thankfull.

$\endgroup$
2
  • 1
    $\begingroup$ If you do a google search on time series and extreme value analysis, lots of references will be displayed. Many of them are in the environmental sciences but the methodology would be the same or similar for your industry. The basic idea of extreme value theory is to incorporate exceedances and outliers into the model to enable forecasting. $\endgroup$
    – user234562
    Commented Dec 11, 2020 at 21:41
  • $\begingroup$ Thankyou for commenting, I've read through some research articles about time series and extreme value analysis and i'm sure I could use the information for my project. @user332577 $\endgroup$ Commented Dec 14, 2020 at 7:51

1 Answer 1

3
$\begingroup$

I use time series for projecting future results. Primarily exponential smoothing models. I was manually modifying future projections to deal with covid, but I found these models have already adjusted for the unusual data (better than my modifications anyhow). One suggestion is to use data you think would have been the correct numbers without the intervention (the COVID impact). I don't think there is any agreed on solution, however, partially because time series is more ad hoc than theoretical anyhow in practice. One possibility is to predict the next six months with various methods and see what works. Of course the problem is that the impact of covid may be gone by then and you will over correct.

$\endgroup$
1
  • $\begingroup$ Replaced the weeks where the values are impacted by COVID with the forecast for these week and it results in a still pretty accurate forecast. I agree with you that there is any agreed solution and time series is ad hoc. A good point of view to have. Thankyou for your time and answer! $\endgroup$ Commented Dec 14, 2020 at 7:54

Your Answer

By clicking “Post Your Answer”, you agree to our terms of service and acknowledge you have read our privacy policy.

Not the answer you're looking for? Browse other questions tagged or ask your own question.