0
$\begingroup$

Overview

I built a linear regression model using the lm() function in R, and the linearity assumption has been violated. All other assumptions have been met. I tried a multitude of transformations on the predictor, but that didn't improve the linearity. The independent variables is U.S. GDP/Capita in a specific year, and the dependent variable is number of suicides in a specific year in the U.S. The regression model has a significant F-statistic and a R-squared value of .69.

The Data (only the first 2 rows)

| year | | gdp/capita | | suicides |
| ---- | | ---------- | | -------- |
| 1987 | | 259574.2   | | 30784    |
| 1988 | | 277240.9   | | 30388    |

Scatter Plot of the Data
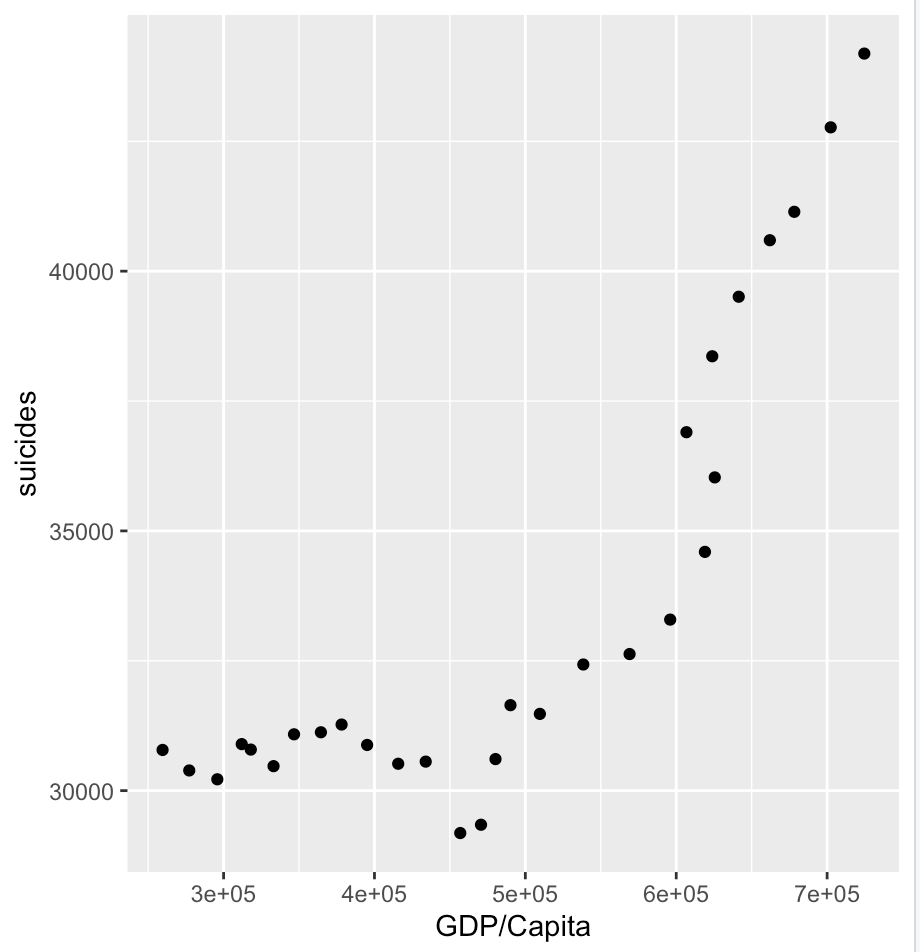
Scatterplot

Residuals vs Fitted Plot indicating non-linearity
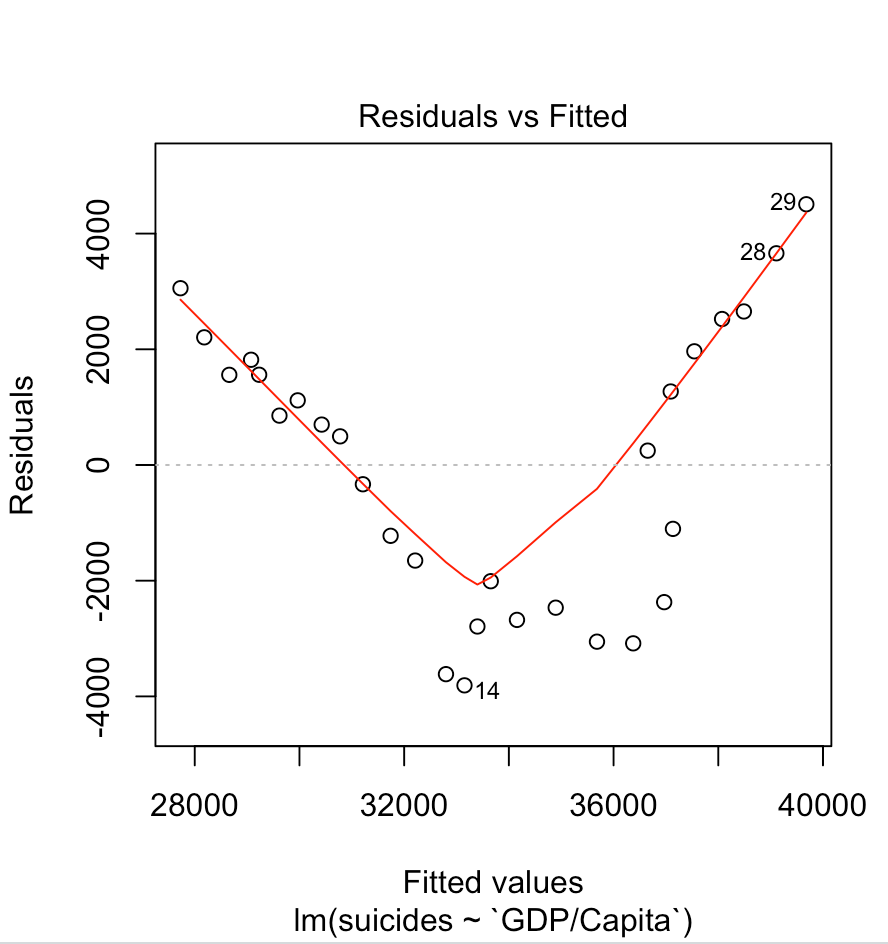
Residuals vs Fitted

$\endgroup$
2
  • $\begingroup$ This is not a programming question, so it is likely not on topic at Stack Overflow. However, let me point out one issue with your model. The US population is not constant per year. The GDP data is per capita (GDP divided by population), but the suicide data is just a total count. The number of suicides may be increasing simply because their are more people. What is the relationship between suicide rate (suicides per population) and GDP per capita? $\endgroup$
    – Ben Norris
    Commented Jan 9, 2021 at 20:08
  • $\begingroup$ @BenNorris Thanks. I can change the suicides variables to a suicides/100k population variable. $\endgroup$
    – maudib528
    Commented Jan 9, 2021 at 20:10

1 Answer 1

1
$\begingroup$

So I'm assuming that your model looked like this:

m1 <- lm(suicides ~ gdp/capita, data = df)

There are a few ways of fitting non-linear models, but the most straightforward at this point would be to fit a quadratic term to your model. You could do that like this:

df$gdp2 <- df$gdp/capita^2
m2 <- lm(suicides ~ gdp/capita + gdp2, data = df)

Another way would be to look into generalized additive models. One package to use would be mgcv, in which case the code could look like this:

library(mgcv)
m3 <- gam(suicides ~ s(gdp/capita), data = df)

Hope this helps. I've pasted a few helpful links about these methods below.

Non-linear terms in linear models: https://www.theanalysisfactor.com/r-tutorial-4/

Generalized additive models: http://environmentalcomputing.net/intro-to-gams/

$\endgroup$

Your Answer

By clicking “Post Your Answer”, you agree to our terms of service and acknowledge you have read our privacy policy.

Not the answer you're looking for? Browse other questions tagged or ask your own question.