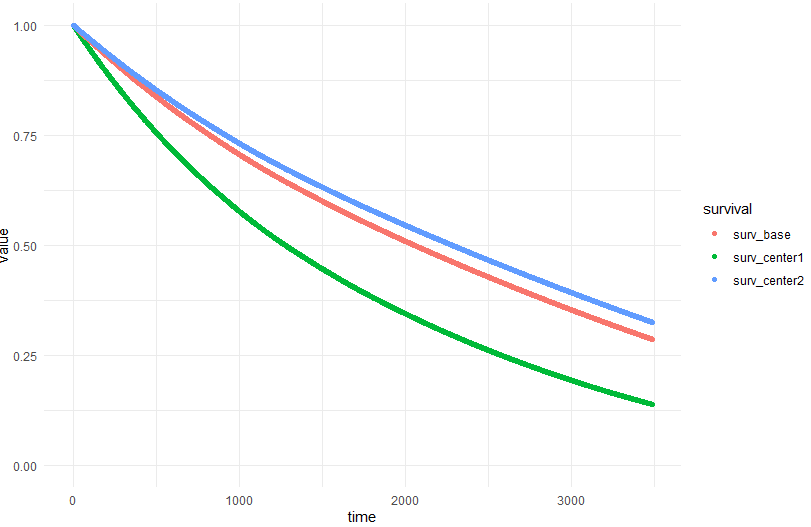
I am interested in deriving and plotting the survival functions from a Cox proportional hazards model with shared frailties. How can I do this?
This question has an answer here, but it is very high level and does not demonstrate a code implementation. I would like to confirm whether the implementation below makes sense. Following the advice here, I am asking this follow-up question as a new question, rather than as a comment on the original question.
In this example, I will use the eortc dataset from the coxme package.
Here's a summary of the steps I've taken:
- Fit two Cox PH models:
fit1is a marginal model (which has no frailty terms), andfit2is a shared frailty model - Use the
muhazfunction to get the baseline hazard function fromfit1 - Use the random effects from
fit2as multiples that act on the baseline hazard function, to give the hazard functions of specific groups - Derive group-specific cumulative hazard functions by integrating the hazard functions (using
bayestestR::area_under_curve) - Derive group-specific survival curves from the group-specific cumulative hazard functions
library(tidyverse)
library(survival)
library(coxme)
library(ggfortify)
library(muhaz)
library(bayestestR)

data(eortc)

# fit models ------
fit1 <- coxph(Surv(y, uncens) ~ 1, data = eortc)  # marginal model
fit2 <- coxme(Surv(y, uncens) ~ (1 | center), data = eortc)  # shared frailty model

# estimate baseline hazard using muhaz: ----
muhaz_fit <- muhaz(eortc$y,
                   eortc$uncens,
                   n.est.grid = 2000,
                   kern = "rectangle"
)
hazard_base_vector <- muhaz_fit$haz.est
times_vector <- muhaz_fit$est.grid

# df with base hazard:
df_base_haz <-
  tibble(hazard_base = hazard_base_vector,
         time = times_vector) %>%
  mutate(index = row_number())  # used to calculate cumulative hazard

# df with group-specific hazards: ----
# random effects act as multiples on the baseline hazard:
df_random_effect_haz <-
  df_base_haz %>%
  mutate(hazard_center1 = hazard_base * exp(ranef(fit2)$center[1]),
     hazard_center2 = hazard_base * exp(ranef(fit2)$center[2]))


# df with derived CHFs, hazards, and survival fns for the RE model: ----
# first define functions for getting chf values at time t
calc_chf <- function(index, hazard_colname, df = df_random_effect_haz){
  df <- as.data.frame(df)
  df2 <- df %>% dplyr::select(time, {{hazard_colname}}) %>% slice(1:index)

  times_vector <- df2[,1]
  haz_vector <- df2[,2]
  return(area_under_curve(times_vector, haz_vector))
}

df_survival <-
  df_random_effect_haz  %>%
  mutate(cum_hazard_base = map_dbl(index, calc_chf, hazard_colname = "hazard_base"),
         cum_hazard_center1 = map_dbl(index, calc_chf, hazard_colname = "hazard_center1"),
         cum_hazard_center2 = map_dbl(index, calc_chf, hazard_colname = "hazard_center2"),

         surv_base = exp(-cum_hazard_base),
         surv_center1 = exp(-cum_hazard_center1),
         surv_center2 = exp(-cum_hazard_center2)
  )


# plot the derived survival curves: ----
df_survival %>%
  pivot_longer(cols = c(surv_base, surv_center1, surv_center2),
               names_to = "survival") %>%
  ggplot(aes(x = time,
             y = value,
             group = survival,
             col = survival)) +
  geom_point() +
  scale_x_continuous(limits = c(0, max(df_random_effect_haz$time))) +
  scale_y_continuous(limits = c(0, 1)) +
  theme_minimal()


survivalpackage contain more information about that than I possess. $\endgroup$