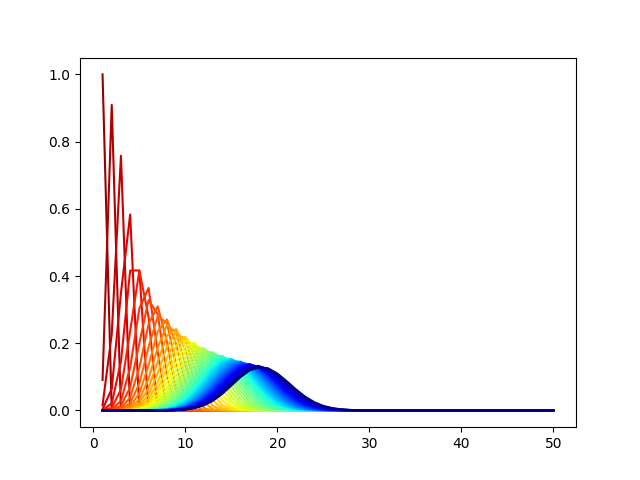
The Chinese Restaurant Table Distribution describes the probability distribution for the number of non-empty tables in the Chinese Restaurant Process after $T$ customers have been seated. Specifically, if $K_T$ is the (random) number of non-empty tables after seating $T$ customers in a $CRP(\alpha)$, its PMF is defined as
$$P(K_T = k) = \frac{\Gamma(\alpha)}{\Gamma(\alpha + T)} |S(T, k)| \alpha^k$$
where $k \in \{1, ..., T\}$ and $|S(\cdot, \cdot)|$ are unsigned Stirling numbers of the first kind. I discovered that when I fix $\alpha$ and plot the distribution for increasing values of $T$, the distribution looks more and more like a Gaussian. For alpha=10.01, I plot the distribution from T=1 (red) to T=50 (blue):
My question is: why does the Chinese Restaurant Table distribution look like a Gaussian distribution for medium-to-large $T$?

