0
$\begingroup$

I am trying to calculate beta diversity using the UniFrac distance on my data, each sample having OTUs values.

To calculate it, I saw it required building a tree with percentages that represented the OTUs. However, I was unable to figure what percentage fit each OTU to build the tree from the instructions I found on the internet.

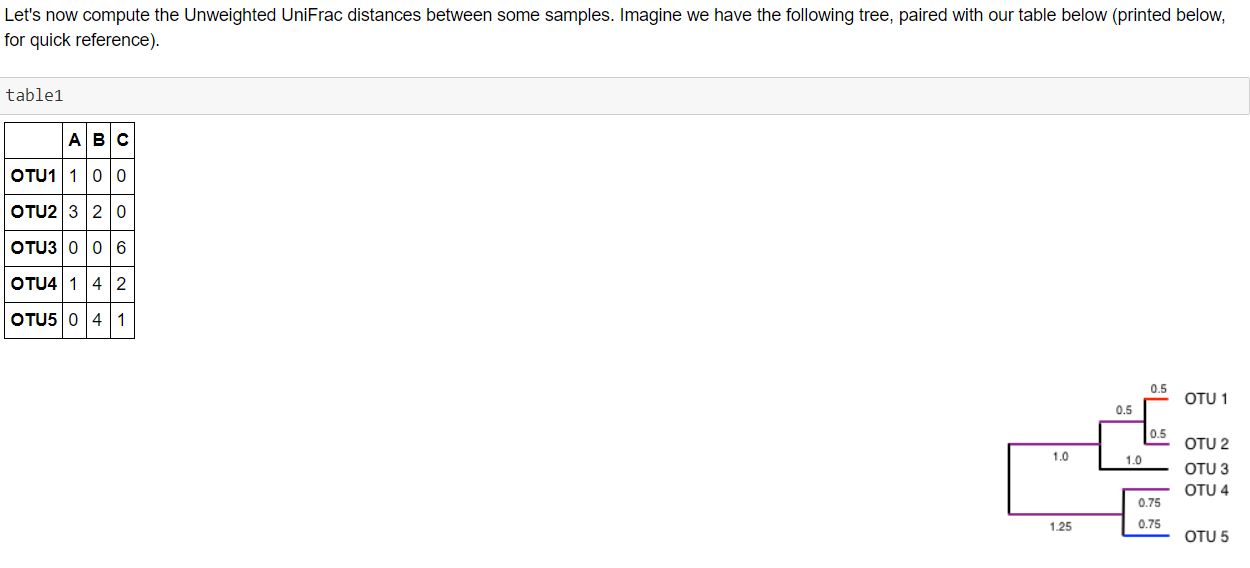
For example, I saw in this link: http://readiab.org/book/0.1.1/3/1#4.1.2, that they build this tree:

enter image description here

Could you please explain to me how to build the tree?

$\endgroup$

1 Answer 1

0
$\begingroup$

That figure is of a phylogenetic tree, showing the relatedness between OTUs. Unifrac makes use of this relatedness, unlike other distance metrics like Bray-Curtis. I'm not quite sure what you mean by 'percentages'? Do you mean the values on the tree - these are normally showing the support for that branch i.e. how certain we are of that particular relationship.

Most people have DNA sequences of the OTU's and use those to build such a tree, although you can also use other characteristics (e.g. morphological). I assume you have DNA sequences, because you're calling them OTU's? Building such trees can be simple (e.g. a distance-based tree based on a DNA alignment), but can also be quite complex. I can't explain all the steps here, but you can find many guides online.

$\endgroup$

Your Answer

By clicking “Post Your Answer”, you agree to our terms of service and acknowledge you have read our privacy policy.

Not the answer you're looking for? Browse other questions tagged or ask your own question.