1
$\begingroup$

I have a cox model as follows, comparing survival of 5 subgroups (one is always a reference). Data is relatively large as n = 12 000; however, the sizes of the subgroups range from 60 to 9000 subjects.

My concern is that the PH assumption is violated because of multiple variables, including the one that I am interested in (group).

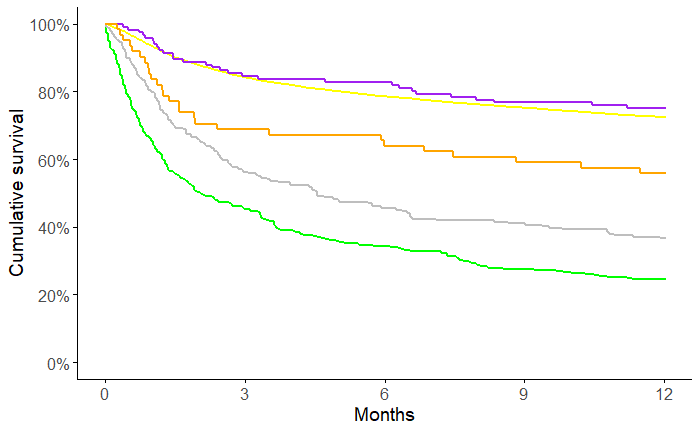
KM curves

enter image description here

MODEL

cox1 = coxph(Surv(time_12m, status_12m) ~ group + age + sex + comorbidity, data = data)

SUMMARY

Call:
coxph(formula = Surv(time_12m, status_12m) ~ group + age + sex + 
    comorbidity, data = data)

                                                                                coef exp(coef)  se(coef)      z                    p
groupB                                                                     -0.104261  0.900990  0.186658 -0.559              0.57646
groupC                                                                      1.357121  3.884991  0.064441 21.060 < 0.0000000000000002
groupD                                                                      1.104889  3.018889  0.086156 12.824 < 0.0000000000000002
groupE                                                                      0.573238  1.774003  0.193463  2.963              0.00305
age                                                                         0.060826  1.062714  0.002122 28.667 < 0.0000000000000002
sexMale                                                                     0.447372  1.564196  0.040747 10.979 < 0.0000000000000002
comorbidity                                                                 0.128723  1.137375  0.009751 13.201 < 0.0000000000000002

Likelihood ratio test=1701  on 7 df, p=< 0.00000000000000022
n= 11200, number of events= 3346 

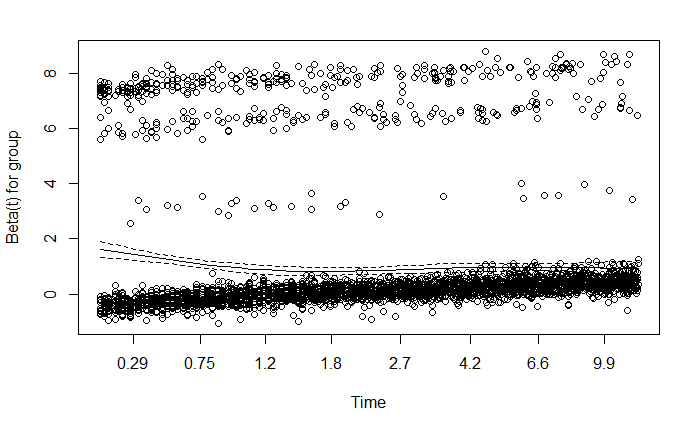
PH assumption testing

test = cox.zph(cox1)
test
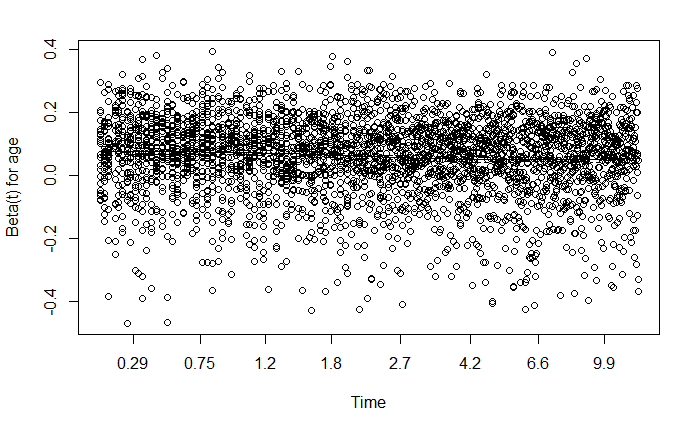
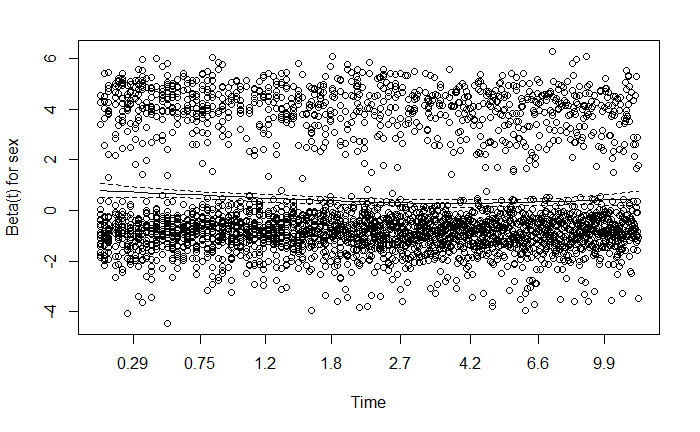
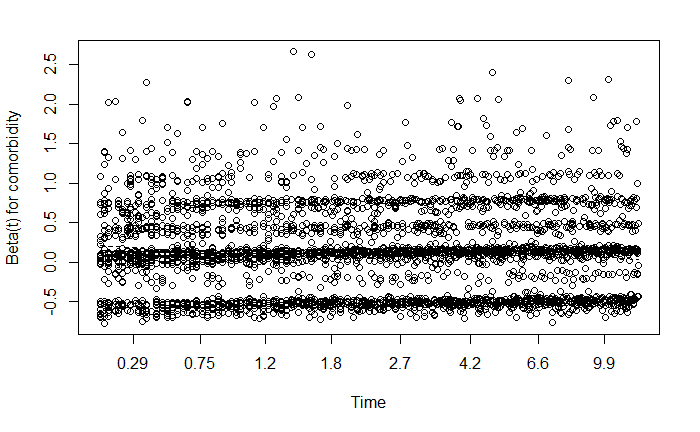
plot(test)

              chisq df        p
group       12.0935  4    0.017
age         16.6103  1 0.000046
sex          2.0608  1    0.151
comorbidity  0.0153  1    0.902
GLOBAL      34.6804  7 0.000013

enter image description here

enter image description here

enter image description here

enter image description here

POSSIBLE SOLUTIONS

a) I tried transforming the age variable, taking log() of it. No help. Transforming the "group" variable is not possible.

b) Stratifying by age leads to a small number of subjects in some subgroups and the "group" variable still caused PH violation.

c) Or should i use splitting the time scale in way that PH is met within each of the time epochs? E.g. 1-2 months, 2-4 months, 5-6 months etc? "Time" variable is manipulated in a way that each of the epochs starts form zero?

d) Can time*covariate interactions solve this problem? I have to use them for "group" and "age". Does it allow me to compare the adjusted survival between groups? Also, "age" is a subject's age at the diagnosis we investigate in the study. Can I then use it as a time-dependent variable?

Or is this a hopeless situation for Cox?

$\endgroup$

1 Answer 1

1
$\begingroup$

With this data set, an approach like "c" would seem to be a good bet. Beyond about time = 1 the smoothed $\beta$ versus time curves are rather flat, so a step-function for all the coefficients as a function of time, with a break at about time = 1, would probably fix the non-proportionality problem. The R survival package time-dependent vignette shows how to do that in Section 4.1.

You also have a very large data set, so it's quite possible that you are finding violations of PH that are statistically "significant" but not of practical importance. You would need to apply your knowledge of the subject matter to decide about that; see this page for a bit more discussion.

Looking at your Kaplan-Meier curves, I would have little trouble believing that 2 of your groups have indistinguishable survival curves, differing from those of the other 3, provided that survival-associated covariates didn't also differ substantially among groups. You should be able to make your point about differences among groups without obsessing excessively over PH.

$\endgroup$
3
  • $\begingroup$ Thanks! Yellow and purple KM curves overlap and they do not differ. Could you please elaborate on the final point of your answer in a little more detail. Seems I do not get the point 100% (maybe because English is not my native language, sorry). I have to check PH or shouldn't? $\endgroup$
    – st4co4
    Commented Mar 10, 2021 at 6:40
  • $\begingroup$ @st4co4 you are only adjusting for age, sex, and comorbidity as controls for your comparison among the groups. So if age, sex, and comorbidity don't differ substantially among the groups, those controls might not be necessary and simple log-rank comparisons between groups might be adequate; the large numbers of events suggests that even with multiple-comparison corrections you would be OK. Then PH isn't an issue. $\endgroup$
    – EdM
    Commented Mar 10, 2021 at 15:42
  • $\begingroup$ @st4co4 the large number of events also means that you can find a "significant' violation of PH that isn't practically important. To decide that, you need to apply your understanding of the subject matter. This possibility is discussed several times on this site, with references to the literature: see this page, or this page. If PH is violated you are getting a type of time-averaged coefficient, which might be good enough; see this page. $\endgroup$
    – EdM
    Commented Mar 10, 2021 at 15:47

Your Answer

By clicking “Post Your Answer”, you agree to our terms of service and acknowledge you have read our privacy policy.

Not the answer you're looking for? Browse other questions tagged or ask your own question.