Intro
What you mention is a well-known—and well-treated—problem in econometrics and social and behavioral sciences, and the solutions fall under (dynamic) structural equation modeling (SEM) and panel data analysis and further (latent) growth curve modeling.
The problem is, based on longitudinal data (multiple measurements over time) you want to make inferences about the relationships between stable (trait-like) and time-varying (state-like) latent variables, and some exogenous variables (time-invariant such as gender; or time-varying such as sleep) and some endogenous variables (e.g., time spent studying, since it can be affected by previous test score). You, then, would want to distinguish between within-person and between-person differences.
A note on terminology:
For the cases where you have a few measurements of many people ($T << N$), the data is often called panel data, and if the number of measurement occasions is large, especially compared to the number of persons ($T >> N$), then you say you have a intensive longitudinal data (ILD) and use time series analysis.
What models can I use?
There are dozens of models capable of doing that, and you can choose one depending on your assumptions and research questions.
I believe a latent trait-state-occasion model would be an appropriate model for your problem, and I highly suggest reading this paper (available on SciHub):
Cole, D. A., Martin, N. C., & Steiger, J. H. (2005). Empirical and Conceptual Problems With Longitudinal Trait-State Models: Introducing a Trait-State-Occasion Model. Psychological Methods, 10(1), 3–20. doi:10.1037/1082-989x.10.1.3
I briefly summarize three possible modeling strategies explained in the paper:
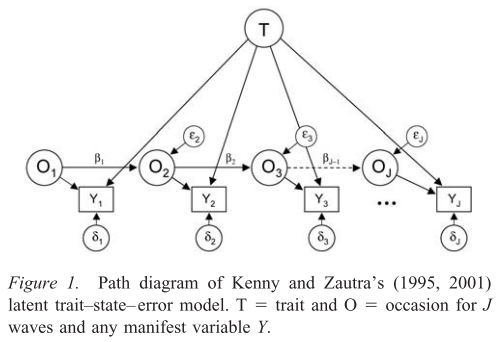
1. State–trait–error model
In this model, your items (questions in IQ test) administered at different times (or "waves"), and you assume that the differences in responses at times $t$ are caused by person-specific trait factor $T$ and occasion-specific latent variables $O_t$. The latent variables $O_t$ can be replaced by any endogenous (and perhaps, exogenous) variable.
If you assume time-invariant model, you may fix the autoregression effects to be equal $\beta_1, \beta_2, \ldots, \beta_{J-1} = \beta$, and you can set them to zero to eliminate any temporal relation.

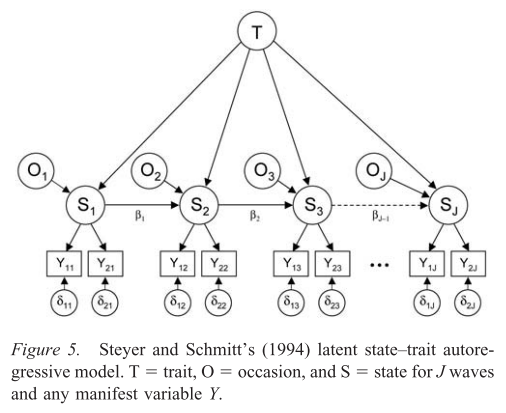
2. Latent state–trait autoregressive model
In this model, you assume the items are measuring students' current ability at answering the administered test ($S_t$).
The $S_t$'s are affected by previous abilities of the student ($S_{t-1}$), contextual/occasion-specific factors ($O_t$), and an underlying time-invariant trait ($T$) that equally influences the student's ability at all times.

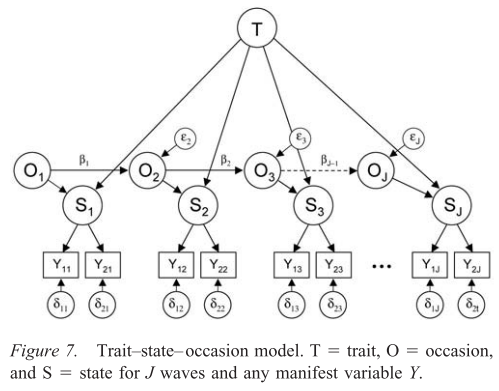
3. Trait–state–occasion model
This is quite similar to the previous model, except that you assume here that the temporal dependencies between states $S_t$ (ability at different times) lie in temporal dependence between occasions (e.g., the student studying/sleep have some sort of autoregressive nature).

Practical matters
Which model should I choose?
The choice of the model is heavily determined by your hypothesized relationships. In case you do not have specific hypotheses to test, you can "let the data speak for itself" and favor one model over the other based on (and choose/identify the "best-fitting model") based on SEM fit indices or information criteria (e.g., AICc or BIC).
How to use these models?
By fitting these models, you get parameter estimates for factor loadings, (co)variances, and AR effects. You can then feed the (preferred) models with students' responses to estimate their latent variables, which are now decomposed into their stable trait and time-specific factors (occasion/context and/or abilities).
Further reading
You may want to look into the following books for longitudinal structural equation models:
Little, T. D. (2013). Longitudinal structural equation modelingemphasized text. Guilford press.
Newsom, J. T. (2015). Longitudinal structural equation modeling: A comprehensive introduction. Routledge.
You should be extremely careful if you want to make inferences about cross-lagged relationships (e.g., if you want to see if sleep and studying affect each other over time). This is not what you want to do here, but this is an extremely important matter, and I suggest reading this paper on it:
Hamaker, E. L., Kuiper, R. M., & Grasman, R. P. (2015). A critique of the cross-lagged panel model. Psychological methods, 20(1), 102.
In case you have intensive longitudinal data (with too many measurements; not feasible for intelligence testing), you may want to use dynamic structural equation modeling (DSEM). See this paper:
Asparouhov, T., Hamaker, E. L., & Muthén, B. (2018). Dynamic structural equation models. Structural Equation Modeling: A Multidisciplinary Journal, 25(3), 359-388.


