4
$\begingroup$

I performed and plotted a kmeans analysis in R with the following commands:

 km = kmeans(t(mat2), centers = 4)
 plotcluster(t(mat2), km$cluster)      #from library(fpc)

Here is the result from the plot:enter image description here
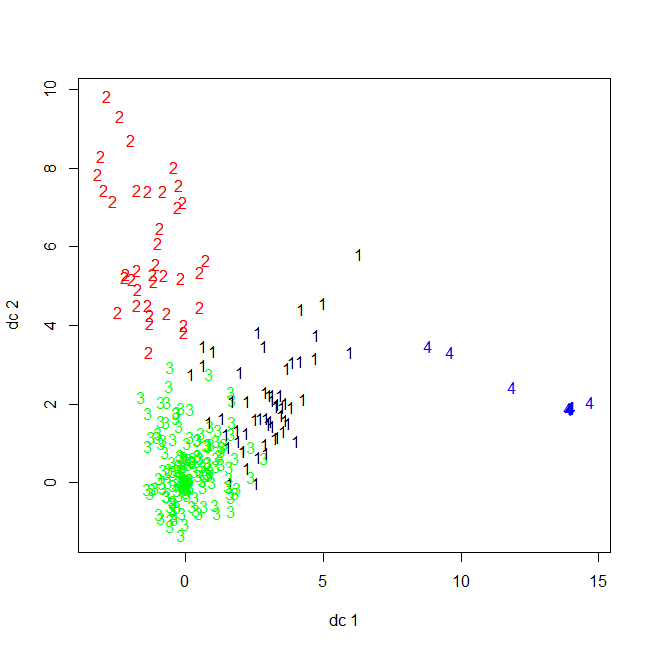
What I want to know is how to make sense of the km$centers attribute and the plot. What I know is that km$centers is a 4 X 31 matrix. Each row represents the corresponding cluster. I think each column represents an iteration in the algorithm (correct me if I am wrong) so the final iteration and result of the algorithm for the centers would be given by:

km$centers[, 31]

 0.008785652 -0.088641371 -0.012666252 -0.079348292 

I must be wrong about a lot because this leads to the following questions:

  1. The centers given bykm$centers are not (x, y) coordinates. How do I get these (x, y) center coordinates?
  2. The center for cluster 4 (according to the plot) must be something like (12, 2) but the above center numbers do not reflect any of these coordinates. In fact every number in the 4 X 31 matrix is less than 1. So, what is the relationship between km$centers and the plot?

The ultimate goal here is to create a matching (not mentioned here) based upon the (x, y) coordinates.

All help is greatly appreciated!

$\endgroup$
3
  • $\begingroup$ Is this question better suited for StackOverflow? $\endgroup$ Commented Mar 8, 2013 at 16:51
  • $\begingroup$ I think it's just on our side of the line since the problem looks to be a confusion about what the "center" means. $\endgroup$ Commented Mar 8, 2013 at 17:31
  • 1
    $\begingroup$ reproducible example please? tinyurl.com/reproducible-000 ... $\endgroup$
    – Ben Bolker
    Commented Mar 10, 2013 at 21:55

3 Answers 3

6
$\begingroup$

I think you're getting hung up on the difference between the center of the actual cluster vs. the center of the 1s, 2s, etc. on your plot.

The actual center of your cluster is in a high-dimensional space, where the number of dimensions is determined by the number of attributes you're using for clustering. For example, if your data has 100 rows and 8 columns, then kmeans interprets that has having 100 examples to cluster, each of which has eight attributes. Suppose you call:

km = kmeans(myData, 4)

Then, km$centers will be a matrix with four rows and eight columns. The center of cluster #1 is in km$centers[1,:]--the eight values there give its position in the 8-D space. Cluster #2's center is in km$centers[2,:] and so on. If you had eighty attributes instead, then each center (e.g., km$centers[1,:], km$centers[2,:]) would be eighty values long and correspond to a point in eighty-dimensional space instead.

This is nice, because preserving the space allows us to interpret the clusters (e.g., these people are very wealthy, have high blood pressure, etc) and lets us assign new examples to the existing clusters. However, it's tricky to actually visualize something with $>3$ dimensions, so plotcluster projects down to a more tractable two dimensions, which can easily be plotted.

My guess is that for matching purposes, you should go with the original centers, rather than the ones given by plotcluster. However, if you really want those, it looks like plotcluster calls discrproj internally, so you could do that yourself.

Links:

$\endgroup$
6
  • $\begingroup$ The reason why I want to match on the 2D coordinates is because I want to essentially click on any point in the plot and then based off of a 2D coordinate mapping, retrieve the data related to that point. $\endgroup$ Commented Mar 8, 2013 at 17:37
  • 1
    $\begingroup$ @CodeKingPlusPlus If your data has more than 2 dimensions (more than 2 variables), this may not be possible. $\endgroup$
    – Zach
    Commented Mar 8, 2013 at 18:01
  • 1
    $\begingroup$ I'm not sure it's totally impossible (unless multiple points end up projected onto the same coordinates, but you might have that problem in the original space too). Use discrproj to project your original data down to 2 dimensions, stash the resulting x,y coordinates somewhere and use them to look up mouse-clicks later. You might consider drawing the actual row/example numbers at each point, then coloring them according to which cluster they "belong to". Couple that with a table of (row ID, attrib values) and it's easy to browse your data, but this breaks down with lots of examples/classes. $\endgroup$ Commented Mar 8, 2013 at 19:07
  • 1
    $\begingroup$ @Matt Krause: I believe that R's identify function requires the coordinates of the points, so if you calculate the x,y with discproj, you can feed them to identify to get back the actual point number. $\endgroup$
    – Wayne
    Commented Mar 8, 2013 at 23:40
  • $\begingroup$ could you provide an example of how to use discrproj to compute the 2D points in the plot? Checkout these other questions I posted as an extension to this question: discrproj parameter, 2D coordinates, identify function $\endgroup$ Commented Mar 10, 2013 at 21:32
4
$\begingroup$

If the kmeans function in base is an option, this will work:

# prepare data (from kmeans help)
x <- rbind(matrix(rnorm(100, sd = 0.3), ncol = 2),
           matrix(rnorm(100, mean = 1, sd = 0.3), ncol = 2))
colnames(x) <- c("x", "y")

# calculate k-means
(cl <- kmeans(x, 5, nstart = 25))

# plot
plot(x, col = cl$cluster)
points(cl$centers, col = 1:5, pch = 8)

# select points of interest
# returns row number of selected point
identify(x[,1], x[,2])
# click away on the plot... 
# then press escape to get the points

# find co-ords for selected point
# in this case, point at row 16
x[16,]
$\endgroup$
9
  • $\begingroup$ What do you mean "If the kmeans function in base is an option?" $\endgroup$ Commented Mar 10, 2013 at 23:18
  • 1
    $\begingroup$ I mean stat::kmeans might not be an option if you're using the fpc package for some functionality that is only in that package. If you paste in the output from dput(mat2) up there in your question then others can work with it also. $\endgroup$
    – Ben
    Commented Mar 10, 2013 at 23:29
  • 1
    $\begingroup$ col = cl$cluster sets the colour of the points in the plot so that points in the same cluster are plotted with the same colour. $\endgroup$
    – Ben
    Commented Mar 11, 2013 at 0:12
  • 1
    $\begingroup$ Thanks so much! With my last edit, I have pretty much reduced my problem down to a solution that your answer will solve. I am doing some testing to see if it is correct. $\endgroup$ Commented Mar 11, 2013 at 1:04
  • 1
    $\begingroup$ Very creative solution! You should post that as a separate answer to your question and mark it as correct for the benefit of future readers. $\endgroup$
    – Ben
    Commented Mar 11, 2013 at 1:10
4
$\begingroup$

identify does not work with the plot given by plotcluster. So to counteract this we need to get the 2 dimensional coordinates that plotcluster is using. In the documentation it is given that plotcluster uses discrproj$proj to get 2 dimensional coordinates. So to get the identical plot that uses plot do the following:

plot(discrproj(t(mat2), km$cluster)$proj, col = km$cluster)

To get identify to work do:

 identify(discrproj(t(mat2), km$cluster)$proj, col = km$cluster)

Now, we can click the points in the plot, and the corresponding row will be given.

$\endgroup$

Your Answer

By clicking “Post Your Answer”, you agree to our terms of service and acknowledge you have read our privacy policy.

Not the answer you're looking for? Browse other questions tagged or ask your own question.