0
$\begingroup$

I've got some simulation data which I'm trying to use to fit some historical data (red points). The simulation isn't a nice function $f(t, a, b, c...)$, instead it's just the result of numerically simulating a system. Is reasonable to take the nearest points in my simulation to each red point, and use these to calculate $\chi^2$ values to compare one simulation to another? Normally in physics we would use the number of parameters in the model to calculate reduced $\chi^2$ using degrees of freedom but I'm not really sure what my degrees of freedom are here. I use the initial and final condition so fix the bounds of my model, so perhaps $\nu = N_{\textrm{points}} - 2$?enter image description here
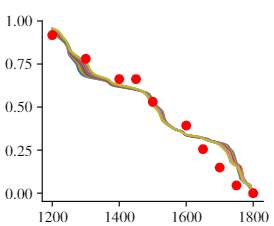
If $\chi^2$ isn't appropriate, is there some other way I can quantify the goodness of fit of my various simulations?

$\endgroup$
3
  • $\begingroup$ "Quantify the goodness of fit" and using a chi-squared test are two (almost) completely different procedures: one is a scientifically meaningful, interpretable measure of agreement while the latter is a hypothesis test--all it can do is detect a discrepancy you can't attribute to chance. Which is the one you really want to do? BTW, the chi-squared distribution won't work here even if you did know the DF (unless you have many more data points): see my discussion at stats.stackexchange.com/a/17148/919 for an explanation. $\endgroup$
    – whuber
    Commented Apr 20, 2021 at 15:37
  • $\begingroup$ Thanks, I think I might be getting confused. In physics we often use the $\chi^2$ goodness of fit parameter which is $\sum (O_i - E_i)^2 / \sigma_i^2$, where $\sigma$ is the uncertainty on observed results. Here I don't really have any uncertainties (I've got exact values for both my simulation and what I'm trying to recreate) so perhaps I've used the $\chi^2$ test parameter by mistake. Would you recommend using mean squared error in that case to quantify goodness of fit in this case? $\endgroup$
    – TIF
    Commented Apr 20, 2021 at 15:41
  • 1
    $\begingroup$ That's one option. The choice depends on the physically right way to compare a point to the curve. For instance, if relative values are important, you might want to use the mean squared log error. $\endgroup$
    – whuber
    Commented Apr 20, 2021 at 15:56

1 Answer 1

0
$\begingroup$

One commonly used measure of fit is mean squared error: $$\frac{\sum{(f(x) -y)^2}}{N}$$

Sometimes this is a good representation of the business loss from error. Often it is used for the less good reason that it is easy to optimise, for some fitting functions $f$. But your $f$ seems to complicated.

Are you trying to fit some free parameters? If you simulations are differentiable, you could do it by stochastic gradient descent.

$\endgroup$
2
  • $\begingroup$ Thanks, that's similar to what I've been doing already, just I've been doing $(y_i-f_i)^2/E_i$, and comparing those values between simulations, possibly without justification. I'm at least comfortable using MSE without having to justify it! My data comes from a complicated model for a physical system so I can't really optimise parameters. $\endgroup$
    – TIF
    Commented Apr 20, 2021 at 15:33
  • $\begingroup$ If I can justifying using degrees of freedom like I mentioned then I'd like to use $\chi^2$ though as that's fairly common in physics $\endgroup$
    – TIF
    Commented Apr 20, 2021 at 15:36

Your Answer

By clicking “Post Your Answer”, you agree to our terms of service and acknowledge you have read our privacy policy.

Not the answer you're looking for? Browse other questions tagged or ask your own question.