2
$\begingroup$

I am looking for methods to detect univariate contextual outliers in time series data. One example application is data from industrial plants in different (unknown) operation modes or slow trends or shifts but no seasonal effects.

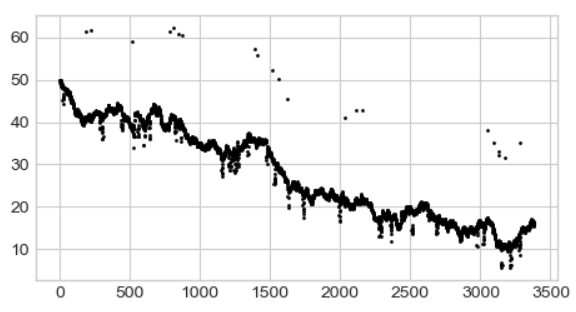
In the following graph visually the contextual outliers above and below the trend can be identified clearly.

enter image description here

Most global outlier detection methods can be used with a sliding window approach. But a method, that automatically derives the optimal window size from the data or even provides an adaptive window size would be beneficial.

$\endgroup$
5
  • 1
    $\begingroup$ If you want to study the seasonal differencies, maybe you could look into outlier detections in the frequency domain. Typically, using periodograms or things like that. $\endgroup$
    – TMat
    Commented Apr 28, 2021 at 13:45
  • $\begingroup$ Thx, seasonal patterns was only one example where contextual outliers occur. I will extend my question. $\endgroup$
    – HansHupe
    Commented Apr 28, 2021 at 13:47
  • 1
    $\begingroup$ If you could comment more on what you mean by "automatically considers the size of the context", that could be helpful. $\endgroup$
    – Gregg H
    Commented Apr 30, 2021 at 23:20
  • $\begingroup$ A changed it in the text. The sliding-window requires to find an optimal window size, usually found by trial and error. I am looking for a method that automatically suggests a window size based on the data. $\endgroup$
    – HansHupe
    Commented May 1, 2021 at 6:52
  • $\begingroup$ with what lag do you need to detect the outliers? For example, classify y_{t} as an outlier on y_{t+1} (with a one period lag) $\endgroup$
    – user603
    Commented May 1, 2021 at 11:53

2 Answers 2

1
+100
$\begingroup$

Taking your description as a starting point, using ADWIN combined with kernel density estimation (KDE) could fit the bill.

The ADWIN algorithm automatically adjusts the window size given the level of the signal. After a window size adjustment, one is left with a set of observations in the window that are supposed to have the same level.

Using KDE one can then estimate the density of this set (note: without any distribution assumptions since KDE is non-parametric) and hence detect outliers. If you are unfamiliar with KDE, it is quite simple: Youtube will have you up to speed in 3 minutes.

A reference to this setup can be found here

Let me know how you fare; I would be interested.

$\endgroup$
2
  • $\begingroup$ Sounds promising, I will try it soon and give feedback, thx. Also double exponential filters might be an option as they are able to handle trends (?). $\endgroup$
    – HansHupe
    Commented May 1, 2021 at 12:03
  • $\begingroup$ Fyi, Also this approach couldn't detect all outliers as expected, especially during trends like around point 1500 below the trend. Other things i will try: first explicit detrending (but requires window length to tune) or model based with trend component (holt exp. filter., arima etc., but requires also smoothing factor to tune). I am still surprised that there is no better solution, as a human without process know how most outliers are obvious. $\endgroup$
    – HansHupe
    Commented May 6, 2021 at 6:46
2
$\begingroup$

I would need more information, but judging solely from your plot, it looks like a simple median filer (not average/mean) would do the job. If your outliers are single ticks, even a median filter of window size 3 would be able to discard them. But if the outliers show well-defined peaks, the window size should be roughly larger than the peak bases.

$\endgroup$
3
  • 1
    $\begingroup$ I experimented with median / hampel filters. They have the disadvantage that trends in data can lead to false positives.Additionally the open question still remains that the window size must be set manually. $\endgroup$
    – HansHupe
    Commented May 1, 2021 at 12:05
  • $\begingroup$ The other issue was that real outliers during trend periods cannot be detected if the threshold is too high, and otherwise there is a risk of false positives. I think either adaptive windowing or a model-based approach with trend component could work. $\endgroup$
    – HansHupe
    Commented May 1, 2021 at 12:14
  • $\begingroup$ Alas! Thank you for the update. $\endgroup$
    – spdrnl
    Commented May 6, 2021 at 12:58

Your Answer

By clicking “Post Your Answer”, you agree to our terms of service and acknowledge you have read our privacy policy.

Not the answer you're looking for? Browse other questions tagged or ask your own question.