I need to generate random numbers that follows a given distribution f(x). Consider the following acceptance-rejection method:
- I generate two random numbers, $r_1$ and $r_2$, both from 0 to 1 that uniformly distributed;
- My variable of interest $x$, is generated as $x = x_{min} + r_1 (x_{max} - x_{min})$;
- To make the acceptance test, I use a second variable $u$ that is given by $u = r_2 f_{max}$;
- If $u < f(x)$, I accept $x$, otherwise, I reject $x$.
I tested it with the following function
\begin{equation} f(x) = \frac{3}{8} (1 + x^2) \tag{1} \end{equation}
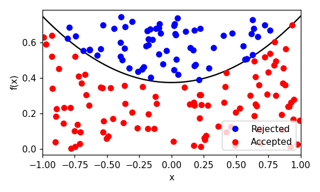
in the interval $-1<x<1$. Then, if we plot $f(x)$ vs $x$, accepted points will be bellow the curve, whereas the rejected above, as the following figure
But my real problem is a lot more complex, once it depends on 3 variables, then I decided to extend the above problem to the case of 2 variables, where equation (1) becomes
\begin{equation} g(x,y) = \frac{3}{8} (1 + x^2 + y^2) \tag{2} \end{equation}
Now I have to change the above algorithm to generate $x$ and $y$. I tested 2 approaches to understand it:
Approach A:
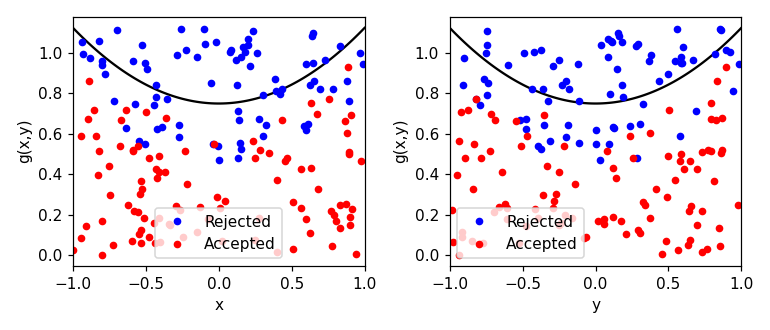
In step 1 I just splitted $r_{1}$ in $r_{1x}$ and $r_{1y}$ and the other steps are quite similar to one dimensional example. However in the step 4, I tried to apply $x$ and $y$ simultaneously in the function and use the same rule (if $u < g(x,y)$ accept $x$ and $y$, otherwise reject them), resulting in
where the black curve has $y = 1$ in the left plot and $x = 1$ in the right plot (once $x=y=\pm1$ gives $g_{max}$). This result looked weird for me, once there are rejection points bellow the curve that I expected to be the limit for them.
Approach B:
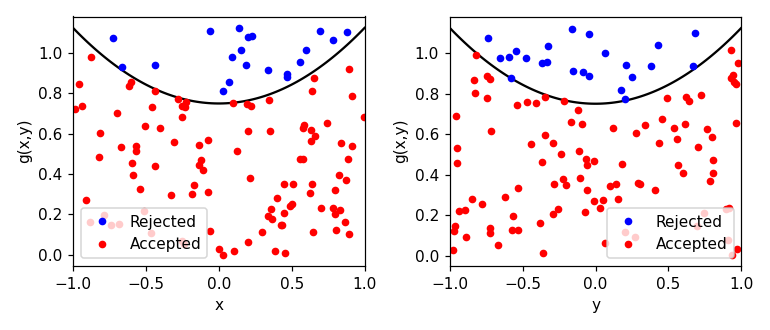
To understand this issue, I changed (splitted) the step 4 in a way where I generate $x$ and $y$ once at a time:
4.1. If $u_x < g(x,1)$ accept $x$ otherwise reject it;
4.2. If $u_y < g(1,y)$ accept $y$ otherwise reject it;
where $u_x$ and $u_y$ are independent versions of the initial $u$ and I used 1 in the function because $g(1,1)$ is its maximum value, resulting in the plot
My question is: what is the right approach to generate $x$ and $y$, A or B?


