1
$\begingroup$

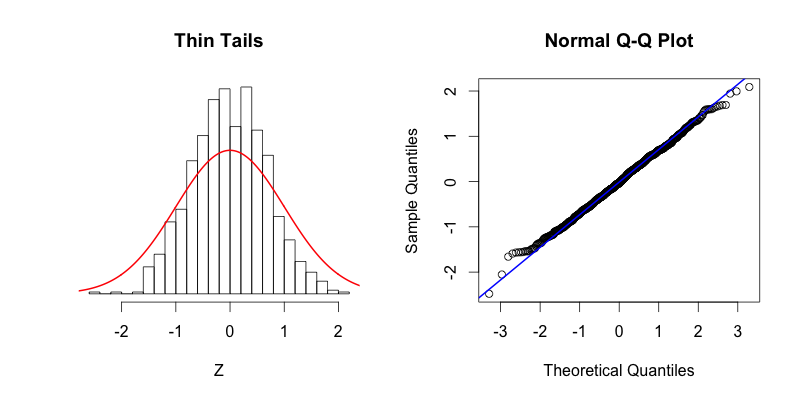
I have some data that looks similar to the example picture below. The difference is that the peaks on the histogram are further above the distribution line and the tails of the Q-Q plot are heavier than in the example.

I am looking for normality in the data, and I was curious about the effect of the peaks and the tails on the conclusion. Will this be a case of non-normal distribution because of the mentioned aspects, or am I not understanding the interpretation correctly?

In addition, a Shapiro test was conducted on the data and the null hypothesis of normality was rejected.
Text

$\endgroup$

1 Answer 1

2
$\begingroup$

Why do you need normality? This distribution looks quite symmetric, and, as you say, with tails thinner than the normal. That means that the central limit theorem (CLT) will need few observations to be effective, so means should be very close to a normal distribution ...

You can check that for yourself by using bootstrapping with your data, or share the data with us.

$\endgroup$

Your Answer

By clicking “Post Your Answer”, you agree to our terms of service and acknowledge you have read our privacy policy.

Not the answer you're looking for? Browse other questions tagged or ask your own question.