I am new in statistics so sorry about my elementary question. I have a data set and simple linear regression equation calculated from this data:
f(x) = ax + b
I would like to know if I can (and if so how) use slope (a) from this linear regression to determine strength of data set trend? I need to know is trend is growing or falling and how strong (steep) is.
I am not sure how to calculate it because there is not max value of tangent value so I'm not able how to find out if it's a strong or weak trend. I hope I described my problem correctly.
Edit: I am working on my school project and I would like to accomplish this: there is a dataset, in my situation these datasets contain a business data (monthly sales, number of orders, an average order size etc.). I would like to have a simple indicator for each of these quantatities that is able to visually describe a trend (a strength) of this dataset in this manner:
- Growth (green color) - if growth is strong, e.g. between 10 - 100% of maximum growth
- Low Growth (yellow color) - if growth is weak, e.g. between 0-9% of maximum growth
- No move (gray color) - no move (when regression has no slope or very small)
- Low drop (yellow color) - drop is between 0-9% of maximum drop
- Drop (red color) - drop is strong, 10-100% of maximum drop
P.S. In my app I have another visual indicator but it describes a dataset in different way - in particular time, how it works - I compute a median value of whole dataset and in a particular point I compare a value in my dataset with median value and determine a color that describes a status in this particular value. Some simple solution I need for the whole dataset.
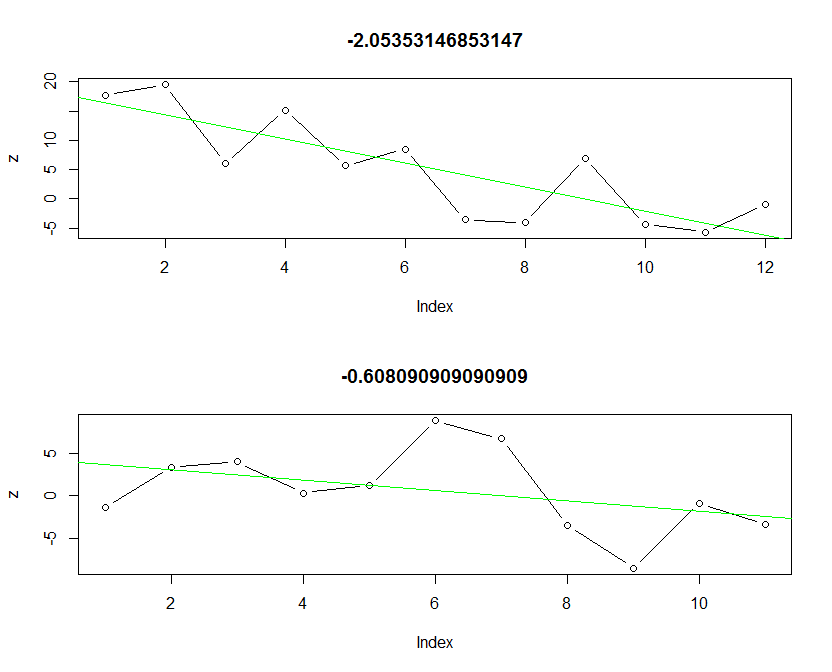
Additional info: to describe what I am trying to solve I created these two plots that plot subset of my dataset. In header there is a slope value of this data subset. Both slopes are negative, so trend in this data is decreasing. This information I can determine myself but both trends are not equal. The first trend is stronger than the second (slope value is higher too). I need to know if is there some scale or dimension according to I can normalize slope value and say in my application, e.g. dataset that describes this slope value is not so much important, because slope is in max 5% of its maximum value but this slope is in 75% of its maximum negative value, so be careful and take care of this trend!
All what I need to know is:
what is minimum and maximum value of a slope parameter in linear regression equation?.
If I know the scale of the slope value I can compute everything I am asking. I can preprocess data and normalize them or do whatever else what is needed.

