6
$\begingroup$

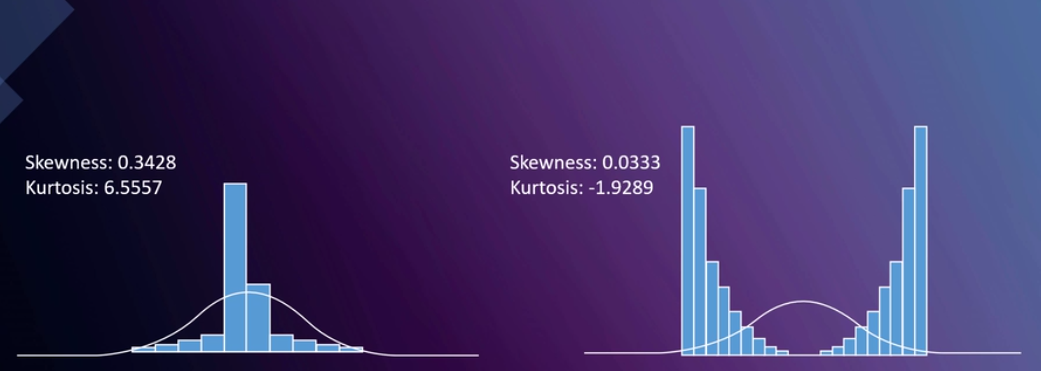
I am trying to understand how the distribution on the right is platykurtic? I learned that platykurtic indicates lighter and thinner tails and from what it looks like, the bimodal distribution, with a superimposed normal curve, seems to have a lot more values in the tails?

Is it light-tailed by the fact that each mode is skewed? Thank you.

enter image description here

$\endgroup$
5
  • 3
    $\begingroup$ Your plots deceive you because the superimposed Normal curves are incorrect: the one on the left is too spread out while the one on the right is less spread than it should be. If you want to compare kurtoses (or any standardized moments), you must plot the distributions so that they have equal variances. If you did not make these plots, then you should look for some other source of reliable information about probability and statistics. $\endgroup$
    – whuber
    Commented Jul 22, 2021 at 14:58
  • 4
    $\begingroup$ If you can access it, you'll find Kurtosis as Peakedness, 1905-2014. R.I.P., Westfall 2014 gives some account of how kurtosis has been widely misunderstood. $\endgroup$
    – Galen
    Commented Jul 22, 2021 at 15:10
  • 1
    $\begingroup$ My personal summary of the usefulness of sample moments as descriptions of parent populations: mean, almost always; variance/SD, usually; skewness, frequently; and kurtosis, rarely. As $k$ in $(X_i-\bar X)^k$ increases, effects of a few unusual observations can become exaggerated and misleading. $\endgroup$
    – BruceET
    Commented Jul 22, 2021 at 18:58
  • 2
    $\begingroup$ @BruceET I generally agree, but one of the "rarely" cases occurs fairly often ;-). As a quick check to see whether a symmetrical-looking dataset might even be remotely Normal, an informal comparison of its kurtosis to $3$ can work well. Large kurtoses are also decent flags of outliers that could mess up certain (non-robust) procedures. For some simulations, even higher standardized moments can be effective. See stats.stackexchange.com/a/51717/919 for an application. $\endgroup$
    – whuber
    Commented Jul 22, 2021 at 19:54
  • 2
    $\begingroup$ Per the title: not all bimodal distributions have lower kurtosis than the normal; it's trivial to construct counterexamples. e.g. take $X$ to be gamma distributed with shape parameter 2 and attach a random sign. The result is clearly bimodal - it has density $0$ at its center of symmetry and peaks either side at $\pm$ $X$'s scale parameter, yet its excess kurtosis is $\frac13$. $\endgroup$
    – Glen_b
    Commented Jul 23, 2021 at 2:33

2 Answers 2

7
$\begingroup$

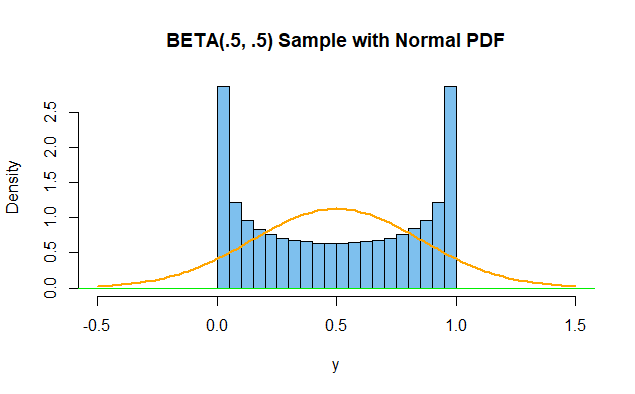
Graphical comment per @whuber's Comment.

Here is a histogram of a sample of a million observations from a beta distribution with shape parameters $\alpha=\beta = 0.5.$ The Wikipedia link has formulas for the mean, variance, skewness, and kurtosis of beta distributions (for given $\alpha,\beta)$. The superimposed normal density curve matches the mean and SD of the sample.

enter image description here

R code for figure:

set.seed(2021)
y = rbeta(10^6, .5, .5)
mean(y); sd(y)
[1] 0.500134
[1] 0.3535411
hdr = "BETA(.5, .5) Sample with Normal PDF"
hist(y, prob=T, br=30, xlim=c(-.5,1.5), col="skyblue2", main=hdr)
 curve(dnorm(x, mean(y), sd(y)), add=T, col="orange", lwd=2)
 abline(h=0, col="green2")
$\endgroup$
6
$\begingroup$

While the incorrect "peakedness" interpretation of kurtosis is finally fading away, it has been replaced by other, slightly less egregious misinterpretations. One is that high kurtosis means "a lot of data in the tails." This may have been started by Balanda and MacGillivray, who "defined" kurtosis "vaguely as the location- and scale-free movement of probability mass from the shoulders of a distribution into its center and tails".

This "interpretation" is a reversal of the implication in the Finucan result, which proves that as mass moves away from the "shoulders" to the center and tails, then kurtosis increases. (Incidentally, there is no contradiction here in the bimodal case because there is no mass in the center). Unfortunately, the Finucan conditions do not tell you what larger kurtosis implies about the distribution. To infer that larger kurtosis implies "more mass in the tails" is akin to stating "well, I know all bears are mammals, so it must be the case that all mammals are bears."

For a simple counterexample of a family of probability distributions where kurtosis tends to infinity, but tail mass decreases, see here: https://math.stackexchange.com/a/2510884/472987

Rather than "mass in the tails," kurtosis precisely measures tail leverage, a combination of mass and extension. Greater extension implies greater leverage, even with little mass (Archimedes boasted that he could move the earth with a long enough lever). A single outlier, sufficiently distant from the pack of data, is enough to create great leverage. Thus, while a comment above seemed to say that kurtosis is "distorted" by outliers (suggesting a nod to the incorrect "peakedness" definition?), the more correct statement is that kurtosis measures outliers.

While outliers are sometimes defined as "mistakes," I am referring to them here as "rare, extreme values." The two-point equiprobable bimodal distribution is the least outlier-prone distribution in the universe of distributions. That is to say, it has the least tail leverage.

Besides my 2014 paper "Kurtosis as Peakedness: 1905-2014. R.I.P.," here are some posts that explain the precise nature of the "tail leverage" meaning of kurtosis.

https://stats.stackexchange.com/a/532055/102879

https://stats.stackexchange.com/a/481022/102879

$\endgroup$

Your Answer

By clicking “Post Your Answer”, you agree to our terms of service and acknowledge you have read our privacy policy.

Not the answer you're looking for? Browse other questions tagged or ask your own question.