4
$\begingroup$

I am working on a linear Regression Model right now, it has the following format:

leisure = ß0 + ß1*age + ß2*log(rain +1) + ß3*log(temperature + 1) + ß4*km + ß5*time

So basically I want to know if rain and temperature has an impact on the number of leisure activities a person spends (leisure is a fractional number) I had to add a small constant when taking the log, because rain and temperature can take zero values. I plotted a Residual vs. Fitted Plot and I am wondering if I interpret it the right way. The red line is nearly horizontal which should indicate that there is a linear relationship between my independent variables and my dependent variable leisure. However the plot also shows me that I have a massiv problem with Heteroskedasticity. I thought about using FGLS to deal with my Heteroskedasticity. I am grateful for any suggestions and input. Thank you

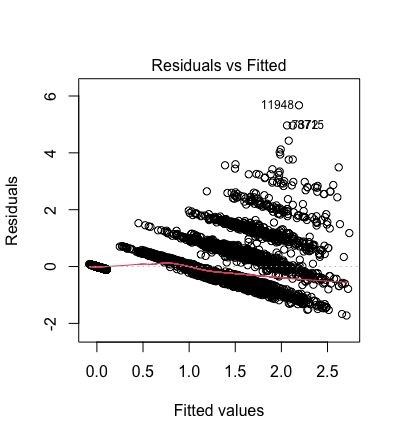
enter image description here

$\endgroup$
14
  • 2
    $\begingroup$ You say the response is a fractional number, but you also say that it is a count. How exactly is it measured / computed ?The residual plot shows that the response is perhaps ordinal, or discreet, so a linear model isn't appropriate here. $\endgroup$ Commented Jul 22, 2021 at 16:02
  • $\begingroup$ yes it is a count variable, however it became fractional in my data frame because it is weighted. $\endgroup$ Commented Jul 22, 2021 at 16:06
  • 5
    $\begingroup$ A "fractional count variable" does not make sense to me. The counting numbers are the positive (or non-negative) integers, not $5.3$. $\endgroup$
    – Dave
    Commented Jul 22, 2021 at 16:14
  • 1
    $\begingroup$ That would be more like if there is a need for a quadratic term (residuals look like a parabola), not a log transform to resolve skewness. $\endgroup$
    – Dave
    Commented Jul 22, 2021 at 19:00
  • 1
    $\begingroup$ That would be a reasonable separate question. Quickly here, just because a quadratic does not fit does not mean that log is the way to go. Consider if the right transformation is sine. $\endgroup$
    – Dave
    Commented Jul 22, 2021 at 19:17

1 Answer 1

6
$\begingroup$

Since your reponse variable is a count, then you need to fit a model for count data, such as a poisson or negative binomial, for example:

glm(leisure ~ age + rain + temperature + km + time, family = poisson(link = "log", data = mydata) 

It appears from the residual plot that you have just used lm

Since your interest is on the impact of rain and temperature, you might want to consider an interaction between these, if you think the effect of one is different depending on the level of the other. Also, a nonlinear association may be indicated - for example when the weather is extremely cold or extremely hot, some exercise may be reduced. So perhaps a quadratic term, or splines would be a good idea.

$\endgroup$
4
  • $\begingroup$ Thank you, I thought I can't take the poisson or negative binomial because I have fractional numbers (so leisure can take any number such as 3.55 or 2.4) $\endgroup$ Commented Jul 22, 2021 at 15:58
  • 5
    $\begingroup$ Don't use fractions - a fractional count does not make sense $\endgroup$ Commented Jul 22, 2021 at 16:18
  • 1
    $\begingroup$ @danielarodriguez It is very unclear how and why you are weighting your counts. But I suspect you should leave the counts unchanged and put the weights into the model instead. $\endgroup$
    – Roland
    Commented Jul 23, 2021 at 6:10
  • $\begingroup$ Thank you, that in fact is a very good idea. The weights were needed to overcome the skewness in my sample in relation to the population, if that makes sense. $\endgroup$ Commented Jul 23, 2021 at 14:48

Your Answer

By clicking “Post Your Answer”, you agree to our terms of service and acknowledge you have read our privacy policy.

Not the answer you're looking for? Browse other questions tagged or ask your own question.