0
$\begingroup$

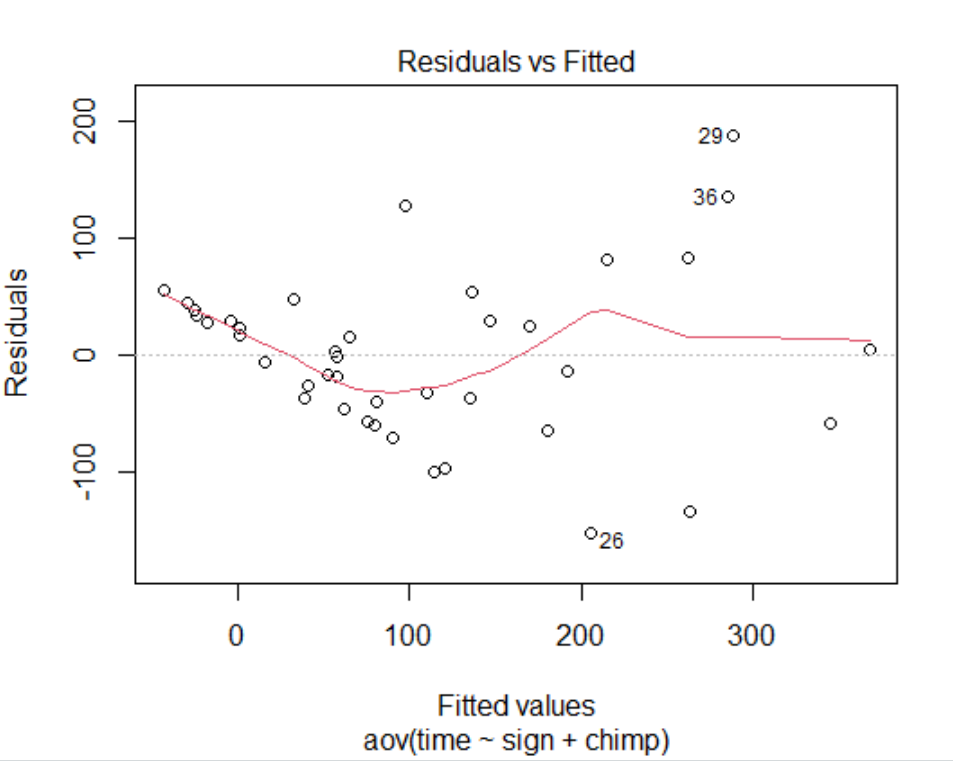
What transformation can I use to fix this residual plot (make the red line horizontal). I tried square root, log, 1/y, and squared. None of them helped.

residual plot

The data is of a 2 way ANOVA: Response Variable = time (in minutes) to teach a chimp a sign. Number of observations = 4 x 10 = 40

  1. Response variable = time (in minutes)
  2. Factor 1 = Sign (10 levels)
  3. Factor 2 = Chimpanzee (4 levels)

Time, Sign, Chimp

178              1         1
 60              2         1
177              3         1
 36              4         1
225              5         1
345              6         1
 40              7         1
  2              8         1
287              9         1
 14             10         1

 78              1         2
 14              2         2
 80              3         2
 15              4         2
 10              5         2
115              6         2
 10              7         2
 12              8         2
129              9         2
 80             10         2

 99              1         3
 18              2         3
 20              3         3
 25              4         3
 15              5         3
 54              6         3
 25              7         3
 10              8         3
476              9         3
 56             10         3

297              1         4
 20              2         4
195              3         4
 18              4         4
 24              5         4
420              6         4
 40              7         4
 15              8         4
372              9         4
190             10         4
$\endgroup$
4
  • $\begingroup$ It's impossible to tell. Could you explain what the variables mean, give some brief summaries of the data characteristics, and tell us what you are trying to accomplish? $\endgroup$
    – whuber
    May 10, 2021 at 21:39
  • $\begingroup$ Nonaparametric smoothing regression? $\endgroup$
    – Alexis
    May 10, 2021 at 21:41
  • $\begingroup$ @whuber just edited in the data set $\endgroup$
    – rabito
    May 10, 2021 at 21:47
  • $\begingroup$ By default, you ought to consider analyzing logarithms of response times, as Fechner's Law suggests. $\endgroup$
    – whuber
    May 10, 2021 at 23:15

1 Answer 1

1
$\begingroup$

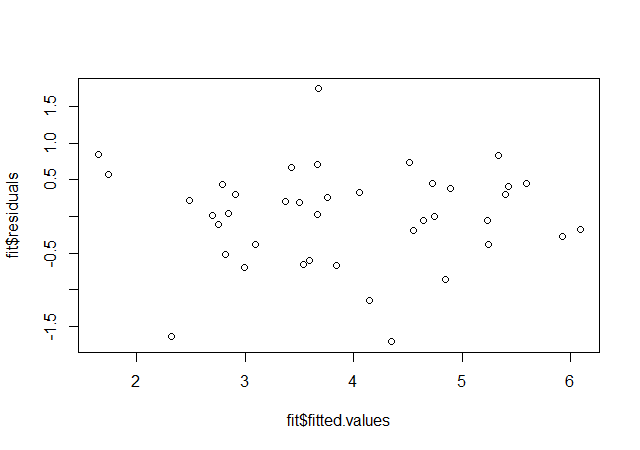
The log transformation does not look bad: enter image description here

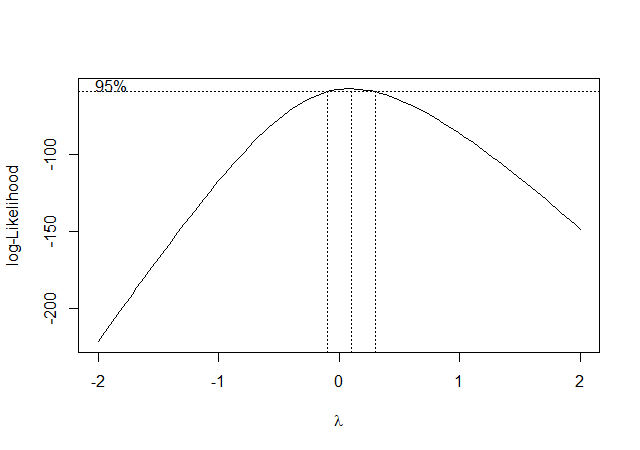
Further, the log transformation is fairly clearly indicated by $\lambda=0$ within the Box-Cox family of transformations: enter image description here

$\endgroup$

Your Answer

By clicking “Post Your Answer”, you agree to our terms of service and acknowledge that you have read and understand our privacy policy and code of conduct.

Not the answer you're looking for? Browse other questions tagged or ask your own question.