2
$\begingroup$

Residual Plot

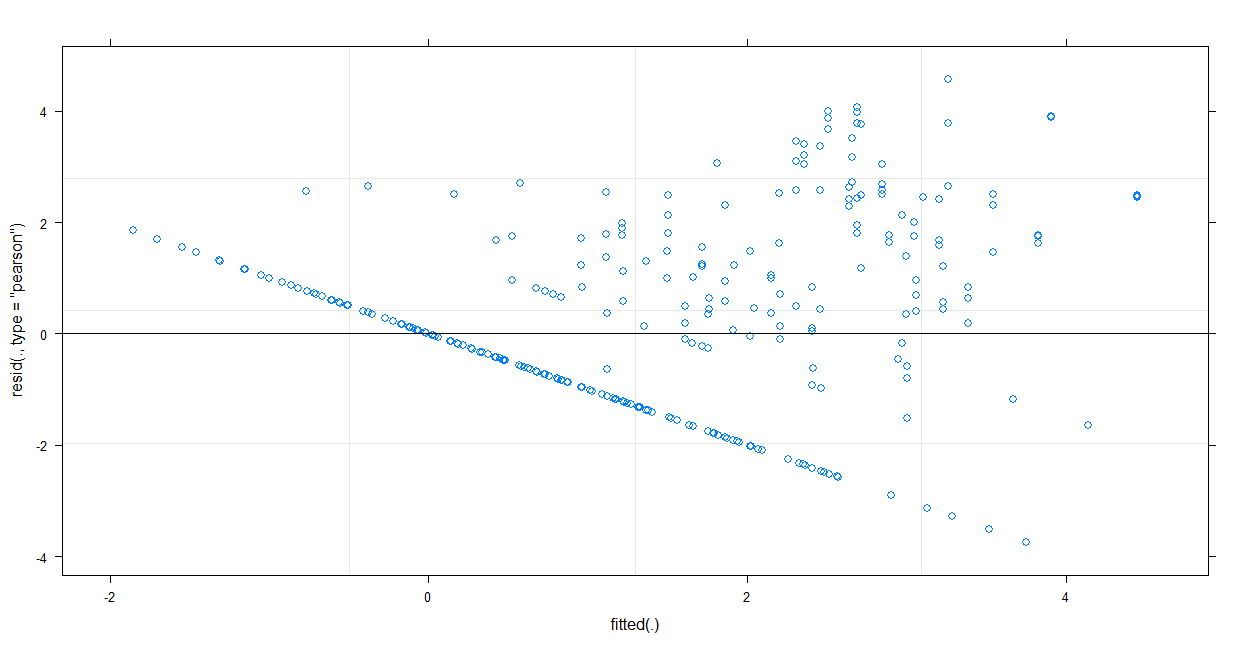
I am still learning about regression and I am currently trying to perform some basic analysis on my experimental data but I do not know how to deal with or interpret this obvious linear line in my residual plot.

How should I go about dealing with this pattern in my analysis?

The data is from microbiological counts which have had a log transformation applied. I have also used a Gaussian distribution in my analysis as I assume I need a continuous distribution if I apply a log transformation.

$\endgroup$
1
  • 3
    $\begingroup$ It appears you did not actually take the log of the count, but rather the log of one plus the count. Since you have plenty of small counts, your data are not suitable for ordinary least squares regression. Have you considered a Poisson model? Compare your plot to the one at stats.stackexchange.com/questions/25068/…. $\endgroup$
    – whuber
    Commented Jun 25, 2019 at 18:33

1 Answer 1

4
$\begingroup$

I bet that line is from data points which have 0 counts. I would recommend switching from linear regression to poisson regression and reassessing residuals after.

$\endgroup$

Your Answer

By clicking “Post Your Answer”, you agree to our terms of service and acknowledge you have read our privacy policy.

Not the answer you're looking for? Browse other questions tagged or ask your own question.