1
$\begingroup$

I am wondering if I can use the predictions from LOESS as a form of predictor transformation in logistic regression? For example, if one of the predictors is X, then can I use predict(loess(Y~X)) as a transformation of X and use it in the logistic regression?

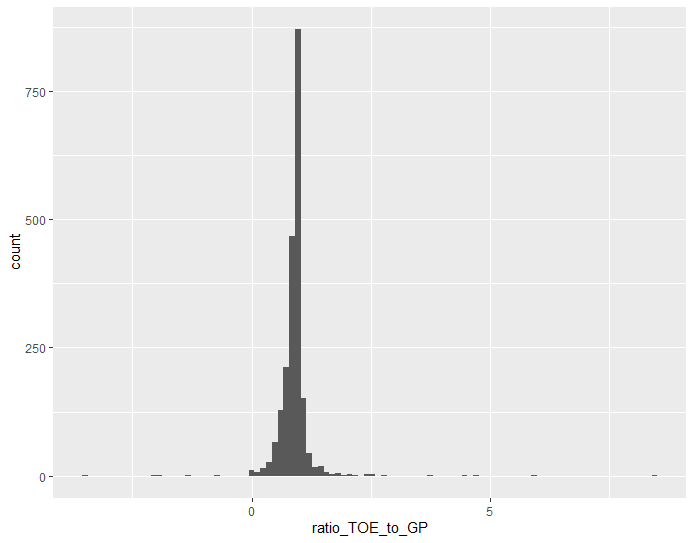
The variable X is a ratio variable which is highly concentrated at its mean while having a handful of outliers. In order to increase the predictive power of X (i.e. finding linearity between X and Y and fulfilling the business requirements), I am thinking of some transformations which can improve the linearity relationship between X and logodds.

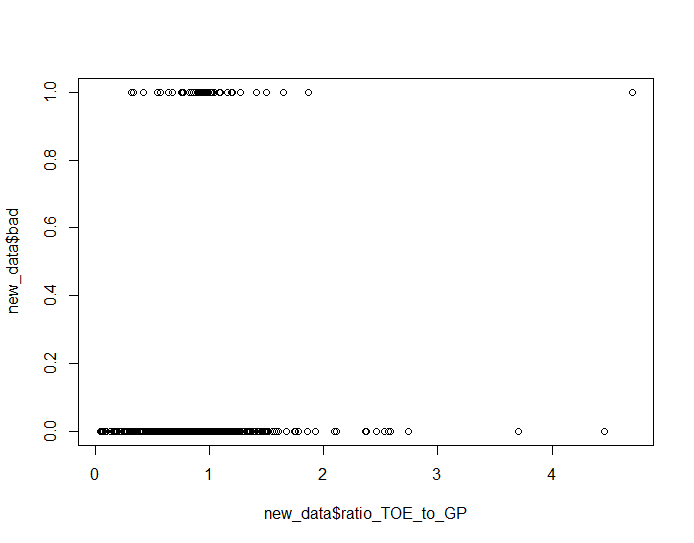
The histogram of variable X X and binary response Y

My concern is that this kind of transformation may cause information leakage as I am using the the response variable Y to guide the transformation. However, does the popular WOE transformation have the similar concern?

Or, could there be other transformations that I can try?

Thanks.

$\endgroup$
4
  • $\begingroup$ Welcome to CV, simohaya! What is the "WOE transformation?" $\endgroup$
    – Alexis
    Commented Sep 20, 2021 at 1:44
  • $\begingroup$ Thanks Alexis. The WOE is short for weight of evidence and it is a popular variable transformation technique in credit scorecard modelling. $\endgroup$
    – simohayha
    Commented Sep 20, 2021 at 2:03
  • $\begingroup$ What happens when you go to make predictions for real and don’t have the $Y$ values? $\endgroup$
    – Dave
    Commented Sep 20, 2021 at 2:47
  • $\begingroup$ Thanks Dave. I have edited my question. $\endgroup$
    – simohayha
    Commented Sep 20, 2021 at 4:53

1 Answer 1

1
$\begingroup$

This kind of transformation can cause information leakage (just think of the case where you smooth do little that the loess curve goes thorough every single point), but may also be helpful for predictive performance (it's probably a bit of a mess when you are primarily interested in inference - splines are probably better understood in that context). It's somewhat related to the popular idea of target encodings (encoding a categorical variable by the mean outcome - with various ideas like shrinking towards the mean to help avoid overfitting/target leakage), which can be very helpful for predictive performance when there's many categories.

I would first consider whether suitable splines could do the job, and of you really want to do this, a lot will depend on good regularisation (i.e. a good choice of the smoothing parameter), for which a good cross validation or other validation set up will be critical (in particular this really needs to test what happens when you apply this to new data - i.e. curve fitted to training data of each CV fold split evaluated on validation part of that fold split). There's also approaches for creating the curve feature from (within each training fold) 4/5 of the training data for the other 1/5 of the data (repeated 5 times for each 1/5 - so, if you cross validate that's 5 times per fold), which help a lot with target leakage for target encodings and might help here, too.

$\endgroup$
5
  • $\begingroup$ Thanks Björn. Could you please provide more info regarding "with various ideas like shrinking towards the mean to help avoid overfitting/target leakage"? As for the suitable splines, maybe I will try to find a spline with a monotonic trend (not sure if there is only one or not). $\endgroup$
    – simohayha
    Commented Sep 20, 2021 at 12:46
  • $\begingroup$ For categories one assigns each category a numeric value like this: (overall avg) * x / ( x + (# of records for category)) + (avg. outcome for the category) * (# of records for category) / ( x + (# of records for category)). I.e. it's a weighted avg. of the category avg. & overall avg. (as if there were an extra x observations in the category with value of overall mean). E.g. if you just used the target avg., then if the outcome is just 0 or 1 and you see a record with a category numerically represented as 0 or 1, you would otherwise know the answer for the record (while this way you don't). $\endgroup$
    – Björn
    Commented Sep 20, 2021 at 12:56
  • $\begingroup$ In the case of a continuous numeric value in your case, the smoothing parameter of the LOESS curve fulfills a similar role. The smoothing parameter (and x in the example above) is chosen based on what value performs well in predicting data not seen during training (i.e. you try different values via cross-validation). $\endgroup$
    – Björn
    Commented Sep 20, 2021 at 12:57
  • $\begingroup$ Really good advice. Thanks Björn. $\endgroup$
    – simohayha
    Commented Sep 21, 2021 at 1:51
  • $\begingroup$ If you found this answer helpful, then please consider upvoting and/or accepting it. $\endgroup$ Commented Oct 9, 2021 at 14:14

Your Answer

By clicking “Post Your Answer”, you agree to our terms of service and acknowledge you have read our privacy policy.

Not the answer you're looking for? Browse other questions tagged or ask your own question.