I have the following data frame which consists of a grouping variable, as well as time ans status variables for survival analysis:
    sample_df <- structure(list(group = c("Group C", "Group C", "Group B", "Group B",
"Group C", "Group C", "Group B", "Group C", "Group C", "Group B",
"Group B", "Group C", "Group B", "Group B", "Group C", "Group A",
"Group C", "Group B", "Group C", "Group B", "Group B", "Group B",
"Group A", "Group C", "Group B", "Group C", "Group C", "Group C",
"Group B", "Group C", "Group C", "Group A", "Group B", "Group C",
"Group C", "Group B", "Group B", "Group C", "Group B", "Group C",
"Group C", "Group C", "Group C", "Group B", "Group C", "Group C",
"Group C", "Group A", "Group C", "Group C"), status = c(0L, 0L,
0L, 0L, 0L, 0L, 0L, 0L, 0L, 0L, 0L, 0L, 0L, 0L, 0L, 0L, 0L, 0L,
0L, 1L, 0L, 0L, 1L, 0L, 0L, 1L, 1L, 0L, 1L, 0L, 1L, 1L, 0L, 0L,
0L, 1L, 0L, 0L, 0L, 0L, 0L, 0L, 1L, 1L, 1L, 1L, 0L, 0L, 0L, 0L
), time = c(379L, 120L, 380L, 419L, 365L, 376L, 1499L, 727L,
607L, 6L, 375L, 364L, 64L, 3L, 366L, 368L, 1523L, 57L, 104L,
180L, 4L, 1111L, 852L, 433L, 2562L, 534L, 490L, 1475L, 1794L,
7L, 744L, 754L, 1484L, 365L, 746L, 161L, 421L, 358L, 532L, 36L,
368L, 523L, 2262L, 1618L, 247L, 83L, 365L, 448L, 1303L, 436L)), class = "data.frame", row.names = c(NA,
-50L))
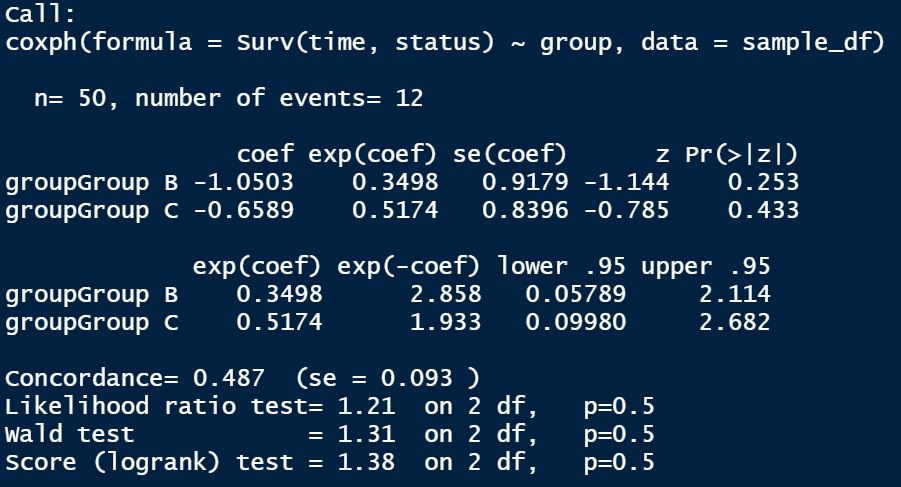
In its present form, the grouping variable is a character variable. When I run Cox regression using the following code, I will get this output:
summary(coxph(Surv(time, status) ~ group, data = sample_df))
So I guess this gives me the hazard ratio and p-values of Groups B and C compared with Group A, respectively.
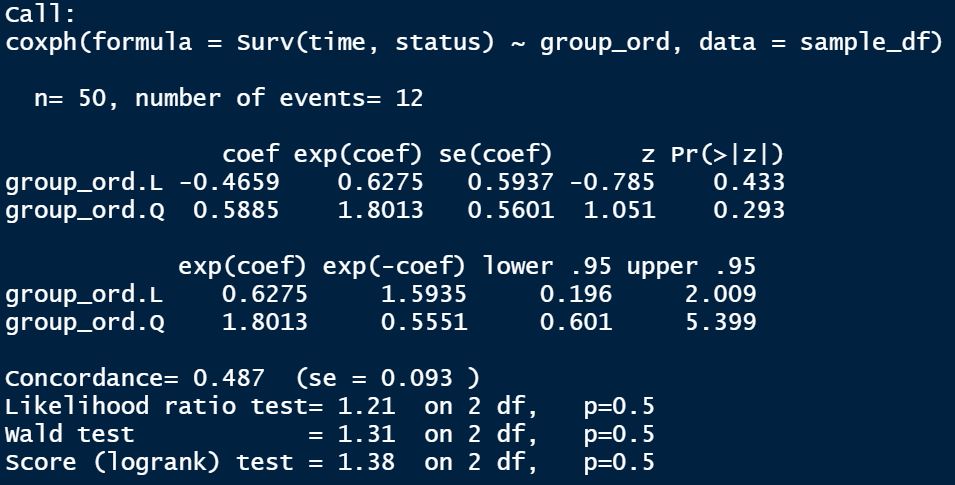
If I change the grouping variable to an unordered factor variable and re-run the Cox regression, I get the same result. So far so good. However, if I change the grouping variable to an ordered factor, I get the following output:
sample_df$group_ord <-
  sample_df$group %>%
  factor(levels = c("Group A", "Group B", "Group C"),
         ordered = TRUE)

summary(coxph(Surv(time, status) ~ group_ord, data = sample_df))
I'm having trouble interpreting these results. What do the "L" and "Q" the the end of the grouping variables stand for? And what do the HR ans p-values refer to??
And finally, I tried using the predictor variable as a numerical variable (changing the categorical variable to a numerical one), like this:
sample_df <-
  sample_df %>%
  mutate(
    group_num = case_when(
      group == "Group A" ~ 0,
      group == "Group B" ~ 1,
      group == "Group C" ~ 2
    )
  )
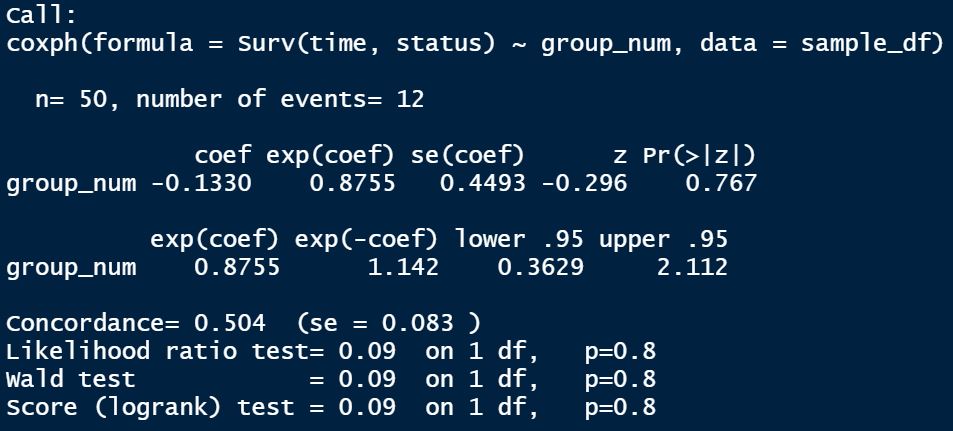
Running Cox regression I get:
summary(coxph(Surv(time, status) ~ group_num, data = sample_df))
This gives me one HR and one p-value. Am I correct in interpreting this HR as the average HR increase per increase in 1 unit of the independent variable?
I'm sorry for this messy post but I hope someone can help me correctly interpret these results.


