9
$\begingroup$

Using the excellent forecast package by Rob Hyndman, I came across the need to not only have prediction intervals, but to simulate a number of future paths, given past observations of a time series with complex seasonalities. There is something for less complex time series with one or two seasonalities only (simulate.ets() in the forecast package), but in my case, I would require the equivalent of simulate.ets() for the more complex tbats model.

I assume that the data necessary for creating such paths is already present in the fit object, yet the possibility to create sample paths seems to be not directly accessible. Therefore, I have come up with a naive solution and would like to know, whether this approach is correct.

require(forecast)
fit = bats(test,use.parallel=T,use.damped.trend=F,use.trend=T,seasonal.periods=seasonal.periods)

Naively, I imagine that sample paths can be constructed by using the point forecast from

fit 

> forecast(fit)
         Point Forecast    Lo 80    Hi 80    Lo 95    Hi 95
1960.016       24.48576 23.82518 25.14633 23.47550 25.49602
1960.032       24.79870 23.88004 25.71735 23.39374 26.20366
1960.048       25.31743 24.39878 26.23608 23.91247 26.72239
1960.065       25.69254 24.77389 26.61120 24.28759 27.09750 
1960.081       26.06863 25.14998 26.98729 24.66367 27.47359
1960.097       26.43215 25.51350 27.35080 25.02719 27.83711
1960.113       26.77674 25.85809 27.69540 25.37179 28.18170

and simply adding randomly drawn values from the model fitting procedure.

> fit$errors
Time Series:
Start = c(1959, 2) 
End = c(1960, 1) 
Frequency = 365 
  [1]  0.140656913 -0.455335141 -0.558989185  1.697532911 -0.114406022  0.366182718 -0.377056927  0.396144296

Therfore, with

prediction = forecast(fit)
errors = fit$errors

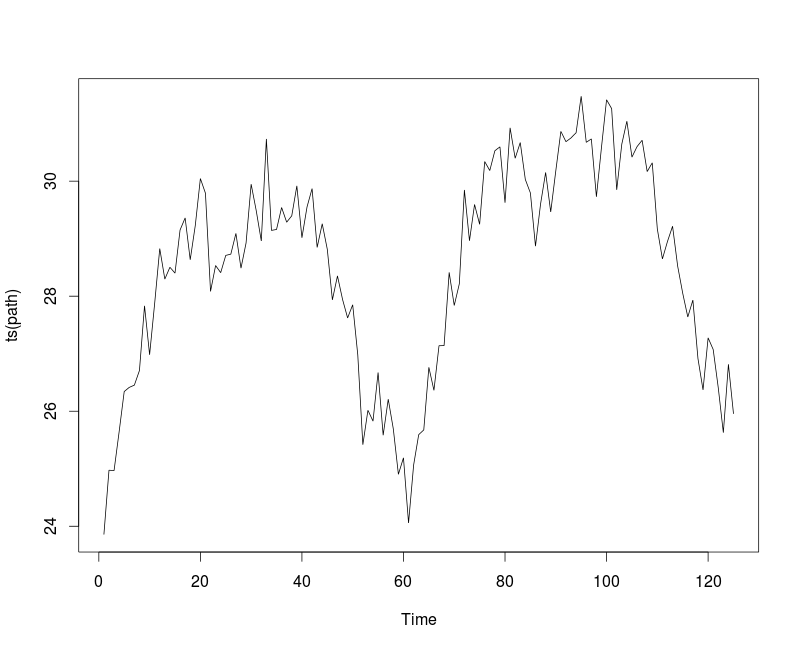
path = prediction$mean + sample(errors, size = length(prediction$mean))
plot(ts(path))

one sample path can be constructed.

enter image description here

Is this a valid way of constructing sample paths? If not, what would be a correct way?

Thanks a lot for any help!

$\endgroup$

2 Answers 2

2
$\begingroup$

No, that method is not valid in general.

Here's a simple, illustrative counterexample. Assume that you have a random walk without drift:

$$Y_t = Y_{t-1} + \varepsilon_t$$ $$\varepsilon_t \sim \mathcal{N}(0,1)$$

This process falls in the TBATS class (it is just an "ANN"-type ETS model with $\alpha=1$, without any complex seasonality, or Box-Cox transform, or ARMA errors).

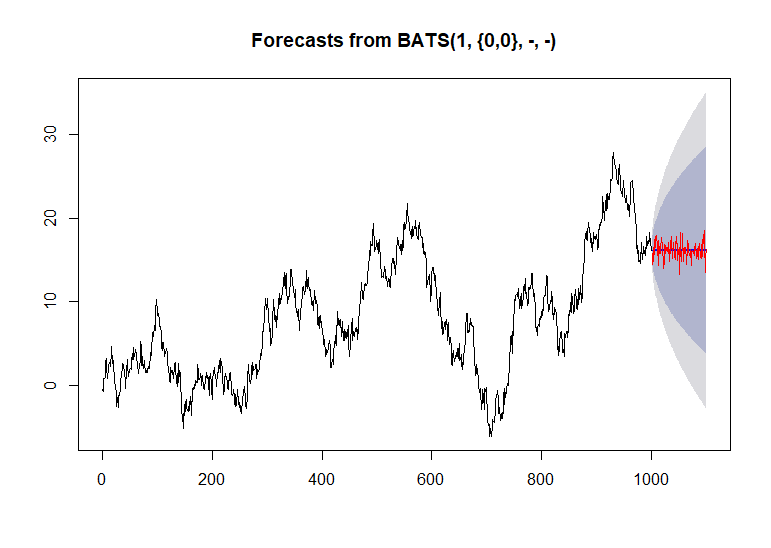
Here's what it looks like if you use your method on simulated data:

enter image description here

The "simulated path" is flat and has a small variance, whereas the original data will stray from its mean level quite a bit. It does not "look" like the original data at all.

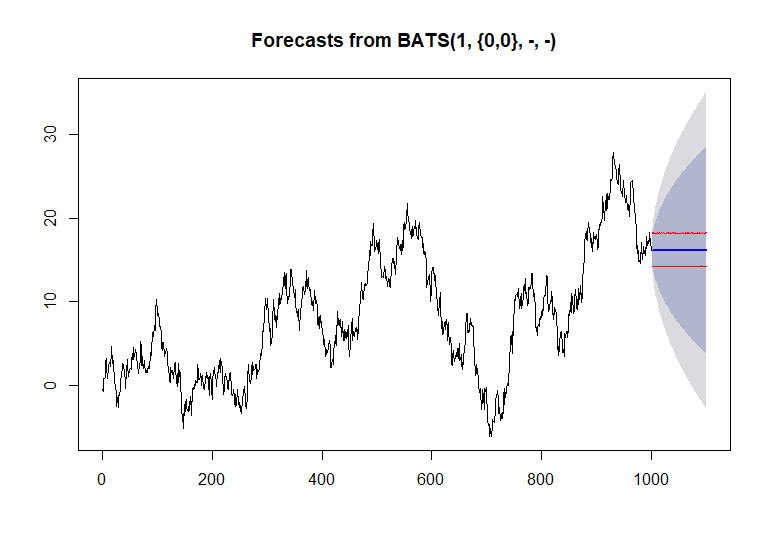
If we repeat the procedure many times and compute the empirical quantiles for the middle 95% of the distribution at each horizon, you will see that they are wrong compared to the prediction intervals reported by forecast.tbats (if the method worked, they should match the outer, grey intervals):

enter image description here

Many time series models can be viewed as a transformation of a sequence of uncorrelated random variables; the exact transformation depends on the model. Given a specific transformation, you can generally take the residuals (call them $\hat{\varepsilon_t}$), resample them, and then apply this transformation to simulate from the same process.

For example, the random walk transforms a sequence of uncorrelated variables $\varepsilon_t$ by the recursion stated above (the cumulative sum). If your original series ends at $T$, you can sample $\varepsilon^*_{T+1}$, from $\{ \hat{\varepsilon_1}, \ldots, \hat{\varepsilon_T} \}$, and apply the same recursion to obtain a simulated value for $Y_{T+1}$, like this:

$$Y_{T+1}^* = Y_T + \varepsilon^*_{T+1}$$

If you compute the quantiles as before, you should come close to the grey area.

In general, therefore, this kind of model-based bootstrap requires slightly different code for different models, to perform different transformations on the resampled $\varepsilon^*_t$. The function simulate.ets handles this for you for the ETS class, but there still does not seem to be an equivalent for TBATS in the package, as far as I can tell.

$\endgroup$
4
  • $\begingroup$ Any recommendation on a way of doing this for TBATS without needing to wade into creating a simulate.tbats method? $\endgroup$ Commented Jul 21, 2019 at 18:08
  • 1
    $\begingroup$ I haven't personally had a need for it and I don't know of an existing implementation, but it should be relatively straightforward to implement. You can either draw the $\varepsilon^*_T$ from $\mathcal{N}(0,\hat{\sigma}^2)$ or by resampling the $\hat{\varepsilon}_i$, as described above. Then just pass those through the model recursions. Note that this will give you a sample from $p(Y_{T+1},...,Y_{T+h}| Y_1, ..., Y_T, \hat{\theta})$ only, so does not include parameter uncertainty, but quoted prediction intervals rarely do. $\endgroup$
    – Chris Haug
    Commented Jul 21, 2019 at 19:09
  • 1
    $\begingroup$ Update: simulate.tbats was added in forecast 8.17.0. $\endgroup$
    – Chris Haug
    Commented Jul 27, 2022 at 14:34
  • $\begingroup$ Thanks @ChrisHaug for following up on this question and providing the pointer to simulate.tbats. $\endgroup$ Commented Feb 6 at 20:00
-2
$\begingroup$

This is probably a very late answer but I do not see why not.

Your approach seems correct. But, there is an easier way to do it.

You have already assigned a variable name to your forecast. You simply need to plot(prediction). By adding the variable h which is the number of periods for forecasting to prediction, you can control the forecast length. For example, you could say prediction <- forecast(fit, h = 48). Note that the value of h depends on how far into the future you want to see.

$\endgroup$
1
  • 1
    $\begingroup$ I am not interested in the plot itself, but to have access to a set of forecasts. $\endgroup$ Commented May 12, 2016 at 12:09

Your Answer

By clicking “Post Your Answer”, you agree to our terms of service and acknowledge you have read our privacy policy.

Not the answer you're looking for? Browse other questions tagged or ask your own question.