2
$\begingroup$

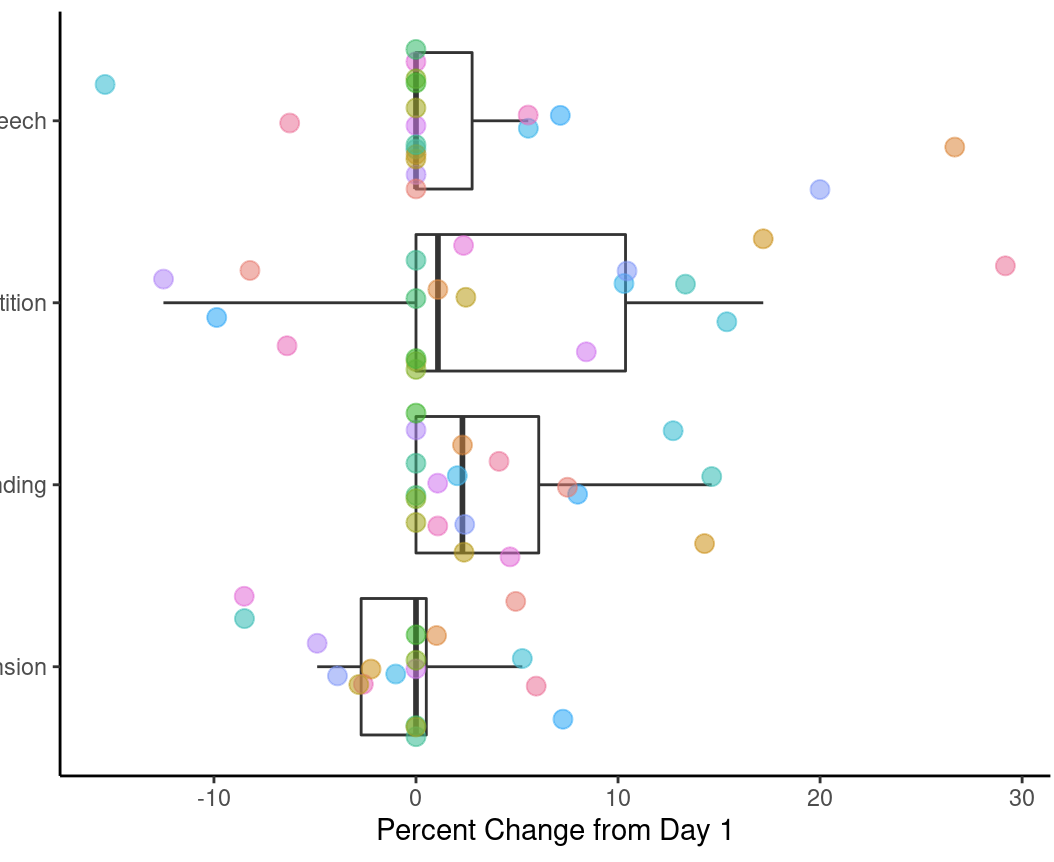
I'm estimating a fixed effects model using Linear Regression with the Huber weighting function. I included a boxplot of the data.

How do we report an F-value and significance for the entire model like I would with the built in OLS Regression (lm) function? Is it even appropriate to report an F-value for the model?

As far as I know, we're running a Wald test on the OLS regression model to get that F-value, but the lmtest::waldtest() function doesn't take rlm models, what are my options?

Call: rlm(formula = change ~ test, data = data, 
    psi = "psi.huber")
Residuals:
     Min       1Q   Median       3Q      Max 
-2.09417 -0.18375 -0.09417  0.25552  3.90583 

Coefficients:
                        Value   Std. Error t value
(Intercept)             -0.0561  0.0937    -0.5986
testa_total              0.2828  0.1325     2.1336
testb_total              0.2398  0.1325     1.8097
testc_total              0.1503  0.1325     1.1338

Residual standard error: 0.28 on 72 degrees of freedom

vs. OLS

Call:
lm(formula = change ~ test, data = data)

Residuals:
    Min      1Q  Median      3Q     Max 
-2.3684 -0.3684 -0.1461  0.2566  3.6316 

Coefficients:
                        Estimate Std. Error t value Pr(>|t|)  
(Intercept)             -0.06053    0.17494  -0.346   0.7304  
testa_total              0.31316    0.24741   1.266   0.2097  
testb_total              0.23421    0.24741   0.947   0.3470  
testc_total              0.42895    0.24741   1.734   0.0872 .
---
Signif. codes:  0 ‘***’ 0.001 ‘**’ 0.01 ‘*’ 0.05 ‘.’ 0.1 ‘ ’ 1

Residual standard error: 0.7626 on 72 degrees of freedom
Multiple R-squared:  0.04284,   Adjusted R-squared:  0.002955 
F-statistic: 1.074 on 3 and 72 DF,  p-value: 0.3656

Standard errors are corrected later to account for clustering and heteroskedasticity.

enter image description here

I will follow up with sample data if necessary but it'll require anonymizing etc. so if anybody can help without it, that'd be great.

$\endgroup$
2
  • $\begingroup$ Friend, please see the following post: stats.stackexchange.com/questions/205614/… Best, =K= $\endgroup$
    – kls
    Commented Dec 13, 2021 at 16:55
  • $\begingroup$ I came across that post and while it does allow a way for performing a Wald test, it doesn't answer the issue of "should" we do a Walk test? If you look at the comments, there's one from Ben Bolker asking "Can anyone comment on whether the standard inferential framework actually works out of the box for robust linear models, or whether these are omitted because the theoretical justification for using the standard approach is weak ... ?". I've yet to see an answer. $\endgroup$
    – myfatson
    Commented Dec 13, 2021 at 18:14

1 Answer 1

0
$\begingroup$

Well, it will not hurt saying (at least in a footnote) that whilst it seems that there is no substantial difference in general between the group means according to the the asymptotic expression, alternative M-estimators more robust to outliers indicate that there might be 1 or 2 groups with conditional means above that of the baseline at the 10% significance level, although the sample size does not allow to make a less conservative statement. Literally, this is what these tables are demonstrating.

You may bootstrap the mean and the median estimators and report the CIs if the centrality/location measure is the focus of your analysis. Otherwise, just make it a tangential statement that you controlled for the possible different level variability in the groups (even if there is no difference, you are safe).

Bonus points for robust standard errors!

$\endgroup$

Your Answer

By clicking “Post Your Answer”, you agree to our terms of service and acknowledge you have read our privacy policy.

Not the answer you're looking for? Browse other questions tagged or ask your own question.