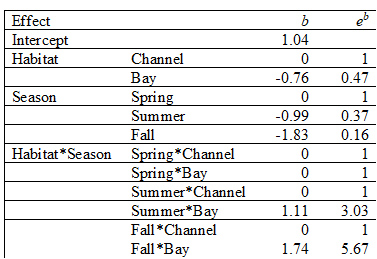
Trying to understand count distributions of a fish species over two habitat types (class variable) and three seasons (class variable). The table below shows the results of a hurdle negative binomial model. I am only showing the count portion of the model. I exponentiated the slopes and can see that counts in bays are 0.47 of those in channel, and counts in summer are 0.37 of those in spring. I am not sure how to integrate the interaction into these estimates. In other words, how does the 0.47 value for bays changes in, say, summer. Thanks in advance.
1 Answer
I exponentiated the slopes and can see that counts in bays are 0.47 of those in channel, and counts in summer are 0.37 of those in spring.
With your interaction terms, those calculations only hold at reference conditions of the other predictors. "Counts in bays are 0.47 of those in channel" only in Spring; "counts in summer are 0.37 of those in spring" only in Channel.
As your analysis seems to use standard treatment coding, the $b$ coefficients for Summer and Fall represent differences from Spring in Channel. The Summer*Bay and Fall*Bay interaction coefficients are the additional differences beyond what you would get for the corresponding Channel predictions.
The best way to proceed is to add up all of the original coefficients $b$ that correspond to particular combinations of conditions that you want to compare. Look at the net difference between the conditions you want to compare, and only then exponentiate.
-
$\begingroup$ Thank you for the good help. So for summer in bays e^(b) is e^(-0.99)+(-0.76)+(1.11) = 0.64. I appreciate it. $\endgroup$– SteveCommented Jan 4, 2022 at 0:07
-
$\begingroup$ @Steve you missed some parentheses but you have the general idea; it's e^(-0.64) = 0.52 That's the ratio with respect to the reference condition of
Channel/Spring. If you want actual estimated counts for a condition you need to include the intercept. It's best not to focus on the individual coefficients but rather examine differences between particular conditions of interest, and let the software perform the calculations along with corresponding confidence intervals. $\endgroup$– EdMCommented Jan 4, 2022 at 15:43 -

