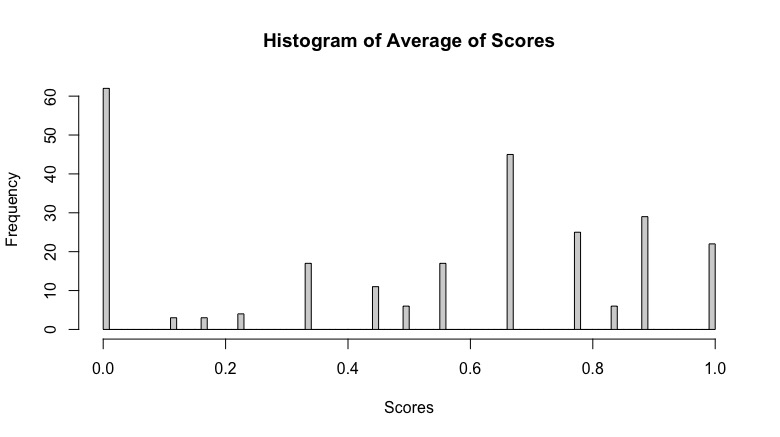
First note, that you are looking for a confidence interval for a mean value (not for a proportion) of n "average scores" $x_1,\ldots,x_n$, so approximately you can use the confidence interval based on the t-distribution ($s^2$ denotes the estimated variance):
$$\overline{x}\pm t_{1-\alpha/2}(n-1)\cdot \sqrt{s^2}$$
As your observables ("average scores") $x_i$ are limited to the range $x_i\in [0,1]$ there is even a strict analytical formula for a $1-\alpha$ confidence interval which can be derived from Hoeffding's inequality:
$$\overline{x}\pm \sqrt{-\frac{\ln(\alpha/2)}{2n}}$$
This interval has a strict (!) coverage probability greater than $1-\alpha$. To prove this, start with Hoeffding's inequality with $a_i=0\leq x_i\leq 1=b_i$:
$$P\left(|\overline{x}-\mu|\geq\frac{t}{n}\right)\leq 2\exp\left(-\frac{2t^2}{\sum_{i=1}^n (b_i-a_i)^2}\right)$$
The sum in the denominator of the right hand side is $n$, and setting $s=t/n$ yields the inequality
$$P\left(|\overline{x}-\mu|\geq s\right)\leq 2\, e^{-2ns^2}$$
Now setting the right hand side to $\alpha$ yields the above confidence interval.
A more general approach that does not require an analytical approximation is repeated sampling with replacement, aka "bootstrap". There are different ways to obtain confidence intervals via bootstrapping, and one of the better methods is the "bias corrected accelerated bootstrap" (BCa). In R, you can compute it as follows:
# function that computes your observable from data
observable <- function(x, indices) {
  x.bootstrap <- x[indices]
  ... # compute your observable from x.bootstrap
  return obs
}

# computation of non-parametric bootstrap intervals
library(boot)
boot.out <- boot(data=x, statistic=observable, R=1000)
ci <- boot.ci(boot.out, conf=0.95, type="bca")
I have done some comparative studies and found the BCa inerval to have better coverage probabilities than the other bootstrap intervals, but poorer coverage probability than analytic approximations if an analytic approximation is possible (see the reference below). I would thus conjecture that, in your use case, the simple approach over the t-distribution will have better coverage probability than bootstrap methods.
Dalitz: "Construction of confidence intervals." Technical Report No. 2017-01, pp. 15-28, Hochschule Niederrhein, Fachbereich Elektrotechnik und Informatik, 2017

