2
$\begingroup$

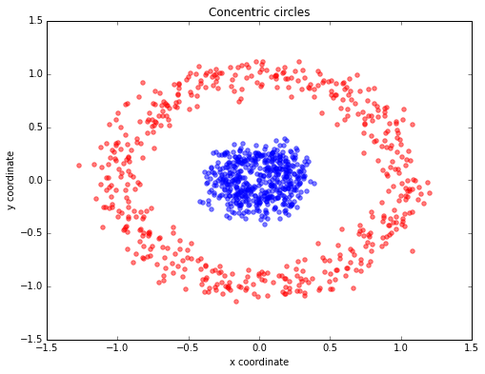
When I look at textbooks on classification and machine learning, many of the examples focus on data that is often twisted up such as to avoid linear separation. I have an example picture below. The common description of the classification problem is that data can be twisted in this manner, and hence kernel methods or random forests are better at dealing with nonlinear decision boundaries. Of course, there is no a priori reason that datapoints should be nicely separated and linearly separable.

https://sebastianraschka.com/faq/docs/large-num-features.html

But I was trying to understand how the data usually gets so twisted up? First, the usual claim is that in high dimension, meaning perhaps dimensions greater than 10 or so, the distance between points becomes so big, that all points are essentially the same distance from each other. If that is the case, then I would imagine that data should not be twisted, because all the points are far from both similar points and dissimilar points.

At the same time, there is this common manifold assumption, where data generally lie on a lower dimensional manifold. But again, how would this manifold assumption reconcile with the distance issues in high dimension? As we add dimensions, points seem to become more equally distant from each other.

So I am just trying to understand how the geometry of high dimensional data evolves, given the contrast between the high dimensional distance issues versus the manifold assumption?

$\endgroup$
7
  • $\begingroup$ This question implicitly assumes "data" refers to some kind of general thing that can be characterized. That's not so. How, then, can we possibly offer any kind of universal characterization of how data behave? $\endgroup$
    – whuber
    Commented Jun 24, 2022 at 19:05
  • $\begingroup$ @whuber , I suppose a better description is tabular data? $\endgroup$
    – krishnab
    Commented Jun 24, 2022 at 19:42
  • $\begingroup$ Almost all data traditionally analyzed in statistics ultimately is "tabular data." Even networks are represented as (sparse) tables. $\endgroup$
    – whuber
    Commented Jun 24, 2022 at 21:31
  • $\begingroup$ @whuber I would say that all data in statistics is numerical "array" data, since an array makes very clear restrictions on the datatypes--at least in numerical computing languages. "Tabular" does not really restrict datatypes, since a table can include strings columns and float columns, so tables cannot be manipulated mathematically in the same way that a float array can be manipulated. $\endgroup$
    – krishnab
    Commented Jun 24, 2022 at 21:53
  • 1
    $\begingroup$ That is an unnaturally limited characterization. Much of the data statisticians and analysts work with is quantitative but not numerical. Regardless, the broadness of any general concept of "data" would seem to preclude the possibility of any meaningful answer to your question. $\endgroup$
    – whuber
    Commented Jun 25, 2022 at 1:07

1 Answer 1

3
$\begingroup$

Textbook examples are not meant to represent the likelihood of encountering particular situations. They are meant to cover a wide range, and give you the ability to recognize and solve certain special situations even if you rarely encounter it in practice.

When I look at textbooks on classification and machine learning, many of the examples focus on data that is often twisted up such as to avoid linear separation. I have an example picture below. The common description of the classification problem is that data can be twisted in this manner, and hence kernel methods or random forests are better at dealing with nonlinear decision boundaries. Of course, there is no a priori reason that datapoints should be nicely separated and linearly separable.

IMHO the keyword here is can. I.e., "if your data looks like this, [linear won't work but] you can do as follows..."

In general, data can be whatever from easily linearly separable over complicated as in the illustration to truly inseparable.

However, we can make statements how typical data of certain types/domains/applications/tasks looks.

"My" data are mostly vibrational spectra.

  • For them, the physics and chemistry behind the data-generation processes mean for particular questions like medical differential diagnosis that chances are quite good that a linear separation (or at least not too complex non-linear) can be found.

    In practical terms it behaves like you reason: since we typically cannot get exponentially more cases (sample size) with increasing dimensionality, the sampling density will be lower and chances are that data are less tangled. Of course, estimating class boundaries is also more uncertain because of the lower sampling density.

    So it may be linearly separable in the original (≈ 1000d) space, but compressed into low dimensionality (say, 10d), class boundaries may become nonlinear.

    BTW, it is typically not clear beforehand whether modeling in original or low-d projection will work better.

  • For other tasks such as quality control where "good" means being not too far away from the target, a (one) linear separation cannot tackle too low and too high at the same time. The data would be expected to behave more like the donut, but without a low-density region between good and bad and maybe with additional red clusters far away.
    And this is expected to be true both in high dimensional original space as well as in low-d projections of it.

$\endgroup$
2
  • $\begingroup$ thanks for the response. Yes, I get what you mean. So there is this connection between the ambient dimension of the data--say 1000d--versus the intrinsic dimension (a term taken from algebraic topology) which may be say a 5 or 10d manifold. So objects can be far in ambient dimension, but closer in intrinsic dimension. $\endgroup$
    – krishnab
    Commented Jun 25, 2022 at 18:29
  • $\begingroup$ The examples you give are also helpful. Say I have an image of a horse and a noisy image of the same horse. So each pixel in the original image has a bit of gaussian noise to make the image blurry. In this case, if I take the distance between images in the ambient dimension--say 784x784, then the pictures are far apart. But if I look the distance between images in the intrinsic dimension, though should be much closer because they are basically on the same lower dimensional manifold. So the "tangling" that I am talking about is in the intrinsic dimension. Am I getting that correctly? $\endgroup$
    – krishnab
    Commented Jun 25, 2022 at 18:35

Your Answer

By clicking “Post Your Answer”, you agree to our terms of service and acknowledge you have read our privacy policy.

Not the answer you're looking for? Browse other questions tagged or ask your own question.