1
$\begingroup$

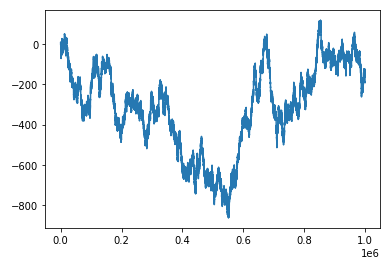
A random walk can be generated by computing the cumulative sum of a list of random numbers.

import random
import itertools
import seaborn as sns
N=1000000
x = range(N)
series = [random.randrange(-1,2) for i in range(N)]   # random integer numbers -1,0,1
walk = list(itertools.accumulate(series))
sns.lineplot(x=x, y=walk)

random walk

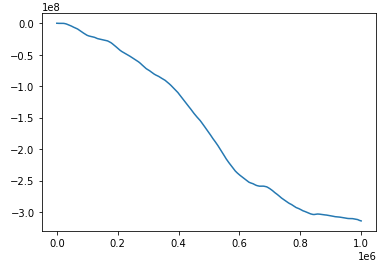
But why stop here? What happens if we compute the cumulative sum of the random walk itself

walk_of_walk = list(itertools.accumulate(walk))
sns.lineplot(x=x, y=walk_of_walk)

cumsum of random walk

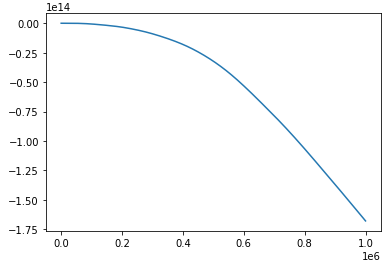
We can even go further and compute the cumulative sum of the cumulative sum of a random walk

walk_of_walk_of_walk = list(itertools.accumulate(walk_of_walk))
sns.lineplot(x=x, y=walk_of_walk_of_walk)

cumsum of cumsum of random walk

To my surprise the cumulative sum and the cumulative sum of the cumulative sum of a random walk looks smoother and smoother than the random walk. Is this to be expected? I couldn't find anything regarding the cumulative sums of random walks. Is there anything known about its mathematical properties? Or am I doing nonsense here?

$\endgroup$
2
  • 2
    $\begingroup$ Yes - it is to be expected. You did not show a chart of your original sequence of $-1,0,1$s but that would have been even noisier than the random walk if you joint the dots, and not autocorrelated. Each cumulative sum introduces more autocorrelation (the new term is close to the previous term) and smoother curves when you adjust the scales $\endgroup$
    – Henry
    Commented Jul 1, 2022 at 21:41
  • 1
    $\begingroup$ Differencing makes strongly positively correlated time series less smooth. (See the easy analysis at stats.stackexchange.com/a/578792/919.) Cumulative sums therefore do the opposite. Research, then, textbook comments about differencing time series for information about this situation. Some additional insight into differencing appears at stats.stackexchange.com/questions/250728. $\endgroup$
    – whuber
    Commented Jul 20, 2022 at 22:44

2 Answers 2

1
$\begingroup$

Define $$S_{i0}=X_i\qquad i=1,\ldots,n$$ and $$S_{i(t+1)}=\sum_{j=1}^i S_{jt}\qquad t=0,1,\ldots$$ then $$S_{i2}=\sum_{j=1}^i \sum_{k=1}^j X_{k}=\sum_{k=1}^i \sum_{j=k}^i X_{k}=\sum_{k=1}^i (k-i+1) X_{k}=\sum_{k=1}^i kX_k - (i-1)\bar X_i$$ and $$S_{i(t+1)}=\sum_{j=1}^i \sum_{k=1}^j S_{k(t-1)}=\sum_{k=1}^i \sum_{j=k}^i S_{k(t-1)}=\sum_{k=1}^i (k-i+1) S_{k(t-1)}$$ meaning that the last terms are more and more heavily weighted and that the scale of the cumulated sums increases as well

$\endgroup$
1
  • 2
    $\begingroup$ This is a good analysis but it falls short of drawing a relevant conclusion. From these weights you can compute all serial correlation coefficients and from those deduce that over short lags they will all be extremely close to $1,$ whence comes the appearance of smoothness. $\endgroup$
    – whuber
    Commented Jul 2, 2022 at 15:06
1
$\begingroup$

Re: smoothness of a Random Walk compared to that of a cumulative sum of a Random Walk.

Smoothness of these functions is determined by their uncertainties :

S = Σ ht(n) ∆n, where ht(n) is a coin toss,{+ /- 1};

∆ S = Σ∆ ht(n) ∆n == ht(n) or +/- 1;

sS = Σ S(n) ∆n,

∆sS= Σ ∆ S(n) ∆n == S(n);

an average S ~ sqrt(n), whereas an average sS= n*sqrt(n).

Thus, ∆S/S = (+/- 1) /sqrt(n);

while . ∆sS /sS = S / ~ sqrt(n) / n*sqrt(n)~ (+/-1) / n.

The uncertainty in S is relatively larger than that of sS.

The uncertainty of S is always (+/- 1) per S, but is (+/-1) /n for sS.

The same argument would apply to the cumulative sum of sS.

{ if S = Σ ht(n) ∆n is called a Random Walk, Then, sS = Σ S(n) ∆n, may be called a Random Absement. }

$\endgroup$

Your Answer

By clicking “Post Your Answer”, you agree to our terms of service and acknowledge you have read our privacy policy.

Not the answer you're looking for? Browse other questions tagged or ask your own question.