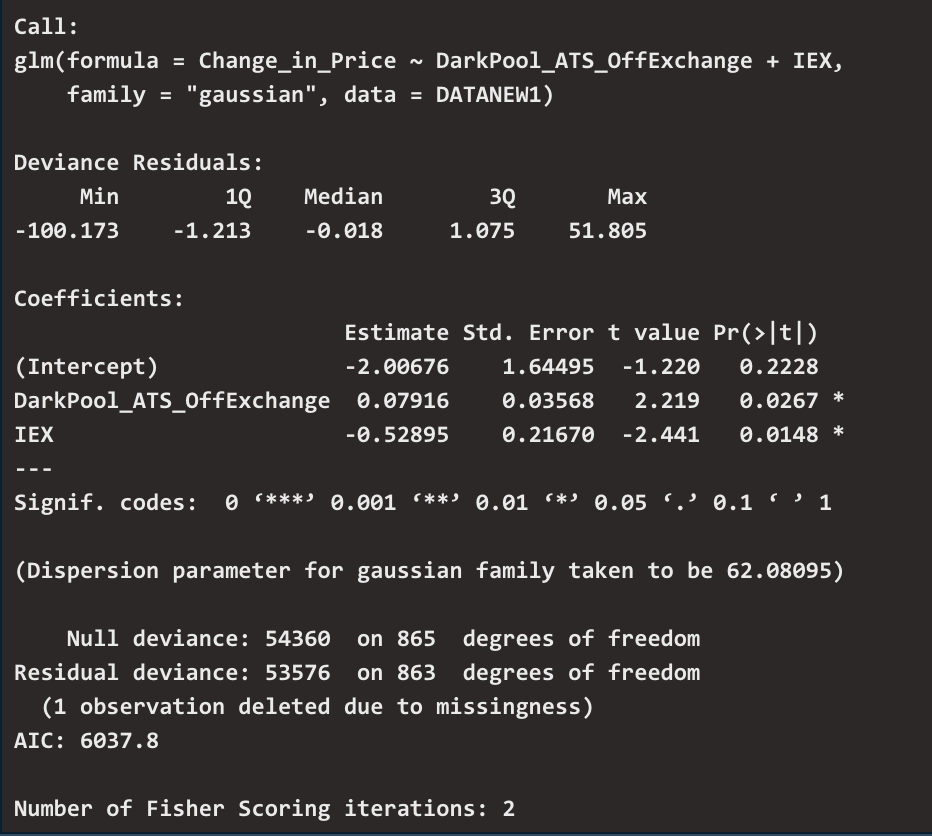
In the comments, @whuber is right: it would be better to replace your last line with a more manageably answerable question such as "How can I achieve ___?" or "Why is it true that ___?" or "How does ___ work?" But I'll point out a few facts of your situation .
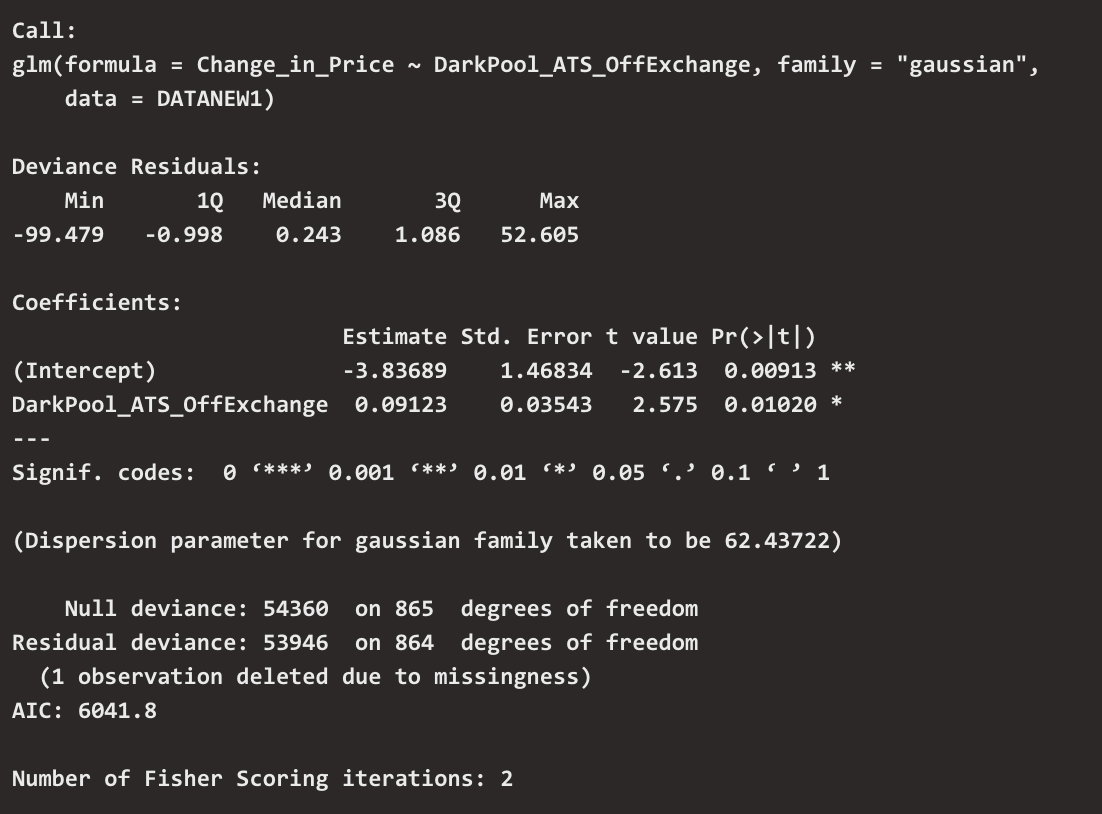
For your first model: you have not really addressed the question of how useful is this model. Your posted output is lean on evidence as to effect size: to what degree is this predictor related to this outcome, and to what extent can this model explain variance in the outcome? You may have run across recent sources such as this American Statistical Association publication, advocating greater attention to effect size and practical significance as opposed to primary focus on statistical significance.
My reading of your results tells me that this model explains 0.8% of the variance in the outcome, since 1 - 53946/54360 = .008. With that R-squared, the standardized regression coefficient, as well as the bivariate r, must be .09. Now, it is not unheard of for such an association to be practically meaningful, but the burden is probably on you to demonstrate that it is in your context. It would no doubt be useful, for a variety of reasons, to create a scatterplot showing the X-Y relationship. One such reason would be to help you further assess to what extent this set of points -- which will resemble a circular cloud much more than a narrow band -- indicates a meaningful connection.


