4
$\begingroup$

I'm pretty confused right now and the more I look at it, the more confused I get. Overthinking!

I'm doing some A/B tests for my website. I'm using the significance calculator that's in this article: http://visualwebsiteoptimizer.com/split-testing-blog/ab-testing-significance-calculator-spreadsheet-in-excel/

It tells me if I've reached significance levels of 90%, 95%, or 99%, based on my views and conversions. However, the p-value differs for different results. What I mean is...

Say I have the following data:

          views   signups  z-score  p-score
control   13329   217
variant   13328   245      -1.3149  0.09426

The calculator tells me I have significance at 90%.

The p-value here is .09426, putting me at 9.4%. The only way I see to make that actually match with over 90% is by subtracting it from 100. So 100 - 9.4 = 90.6.

90.6 > 90 = significance of 90%

But then I have this situation:

          views   signups  z-score  p-score
control   12643   237      
variant   12643   205      1.5356   0.93769

The calculator again tells me that I have significance of 90%.

However here the p-value is .93769, putting me at 93.7%.

93.7 > 90 = significance of 90%

But why is the p-value .09 for one and .93 for the other, when they both reach significance of 90%? For the first, I have to subtract the 9.4% from 100% to get the 90.6% significant rate. The other is .93, already 93%. No subtraction required.

I don't understand. :(

Plain English preferred if possible.

$\endgroup$
2
  • 2
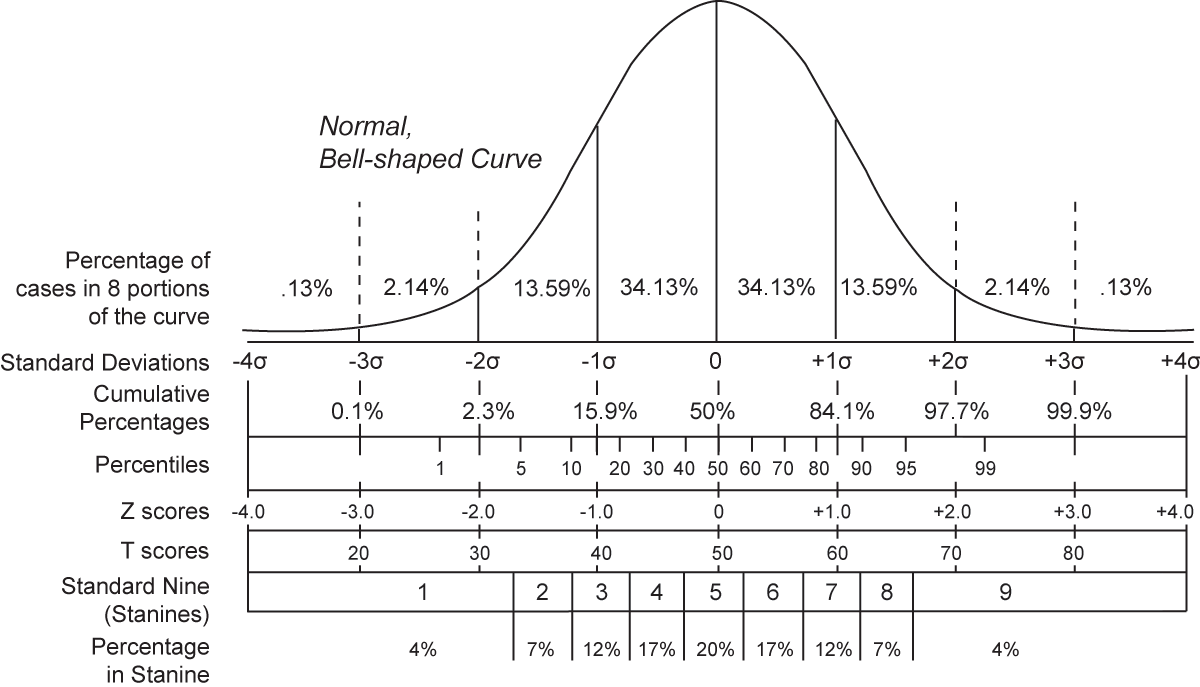
    $\begingroup$ It seems it was set as a one-sided test. The p-value represents the area on the left of the test statistics. There is only 9.426% of area at the left of a z-score -1.3149, but there is 93.769% of area at the left of a z-score 1.5356. The difference in the sign of your z-statistics is due to in test one signups in higher in variant but in test two signups is lower. $\endgroup$ Commented May 9, 2013 at 15:09
  • $\begingroup$ Even better, compute confidence intervals. Then you know how large or small the effect is likely to be. $\endgroup$
    – scellus
    Commented Jan 8, 2014 at 9:35

2 Answers 2

3
$\begingroup$

enter image description here

In one case it looks like the variant made the value go up relative to the control (245 vs. 217) and the other time, it went down relative to the control (205 vs. 237). Since the calc for z-score is:

$Z = \frac{x-\mu}{\sigma}$

In the first test you got a positive z-score, and in the second you got a negative z-score. In both cases the answer is telling you what proportion of the normal distribution is to the left of your z-score. In the first case, it's around 9%. In the second case, there is around 93% of the distrubtion to the left of the z-score (or in turn, around 7% to the right). In both cases, there is less than a 10% chance of getting a more extreme z-value than the one that you got, meaning significance at the 90% level.

$\endgroup$
1
  • $\begingroup$ A graph and everything... Very helpful! I'm new to this stuff; Just plunged into a job and expected to pick it up very fast. Thanks a ton for your help. Very clearly explained. :) $\endgroup$
    – spazzie
    Commented May 9, 2013 at 15:21
1
$\begingroup$

(Initially written as a comment but it was becoming too long)

It seems that there are two errors in the original Excel file that add to the confusion. What it calls the p-value is in fact the value of the cumulative distribution function. It then uses it to perform two one-tailed tests at the specified error rate, effectively doing a two-tailed test with twice the error rate (so 90% is really 80%, 95% is 90% and 99% is 98%).

The proper way to compute a p-value for this test would be to take twice the minimum p-value from the two one-tailed tests. In this Excel file, it would look something like this:

= 2 * MIN(NORMDIST(z_score,0,1,TRUE), NORMDIST(-z_score,0,1,TRUE))

With this formula, the first example yields a p-value of .19 and the second one a p-value of .12. Both can be interpreted in the same way, e.g. by checking if they are under .10 or .05, with no need to invert anything.

$\endgroup$

Your Answer

By clicking “Post Your Answer”, you agree to our terms of service and acknowledge you have read our privacy policy.

Not the answer you're looking for? Browse other questions tagged or ask your own question.