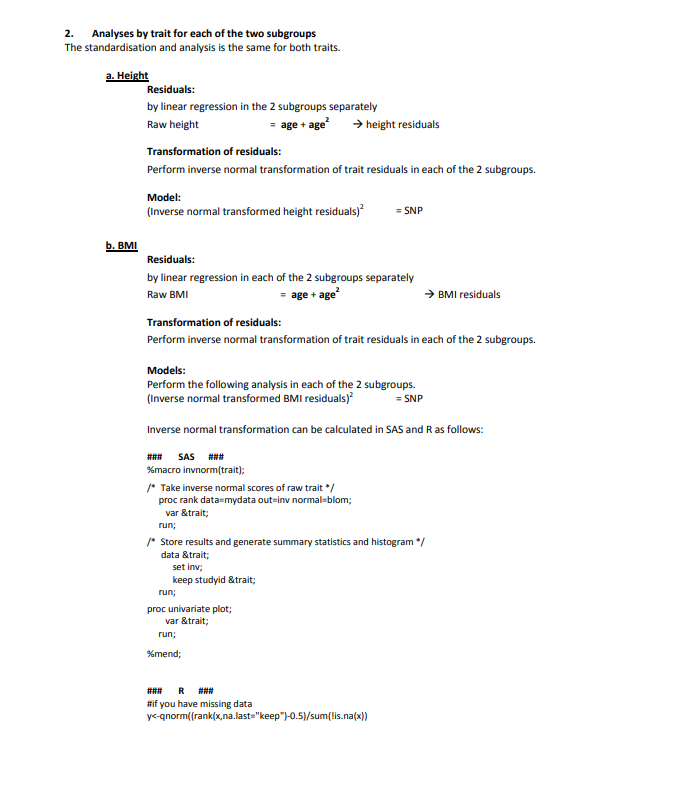
Basically you start with the assumption that your variable is normally distributed, and actively ignore any empirical information that that might not be the case. Actively ignoring empirical information is usually a very bad idea, so most often the advise is just "don't do that". However, since you ask how this works I will still give you an answer, with the caveat that you really really really do not want to use it. Seriously, don't do it! I think I am pretty clear, but just to be really certain: don't do it!!!!!
Say we have 10 observations on a variable x:
id  x
------
1   4
2   5
3   3
4   6
5   1
6   7
7   0
8   2
9   9
10  8
You can sort your data on x
id   x
 7   0
 5   1
 8   2
 3   3
 1   4
 2   5
 4   6
 6   7
10   8
 9   9
You than create a new variable that represents the proportion of the data that contains values on x less than yourself: $\frac{\textrm{# obs less}}{\textrm{# of obs}}$. That way we are not treating the first and last observation symmetrically, so we typically add a correction factor $\frac{\textrm{# obs less + 0.5}}{\textrm{# of obs}}$
id   x  pless

 7   0   .05
 5   1   .15
 8   2   .25
 3   3   .35
 1   4   .45
 2   5   .55
 4   6   .65
 6   7   .75
10   8   .85
 9   9   .95
If we assume that x should have been standard normally distributed (and ignore the empirical observation that in this case it looks nothing like a normal distribution...), then we can use these proportions to get the "true" values. At the end of any introductory statistics book you will find a table for the standard normal distribution, which reports for a lot of values the proportion less then that value. Typically only for positive value, but since the normal distribution is symmetric, that does not matter. Moreover, you just use you favorite computer program that typically has a function called something like invnormal(). Then you get something like:
id   x     pless        z
 7   0   .05   -1.644854
 5   1   .15   -1.036433
 8   2   .25   -.6744897
 3   3   .35   -.3853205
 1   4   .45   -.1256614
 2   5   .55    .1256614
 4   6   .65    .3853204
 6   7   .75    .6744897
10   8   .85    1.036433
 9   9   .95    1.644853
The z is the values you are looking for. But notice, that what you have done is just use the rank ordering of x and the assumption that it should have been a normally distributed variable. So to repeat the point I made before: it is almost always a very very very bad idea, and don't do this!


