I've got a set of (continuous) values from a measurement, where each object should be either positive or negative, and I know that the values of the "negative" objects should be approximately normally distributed.
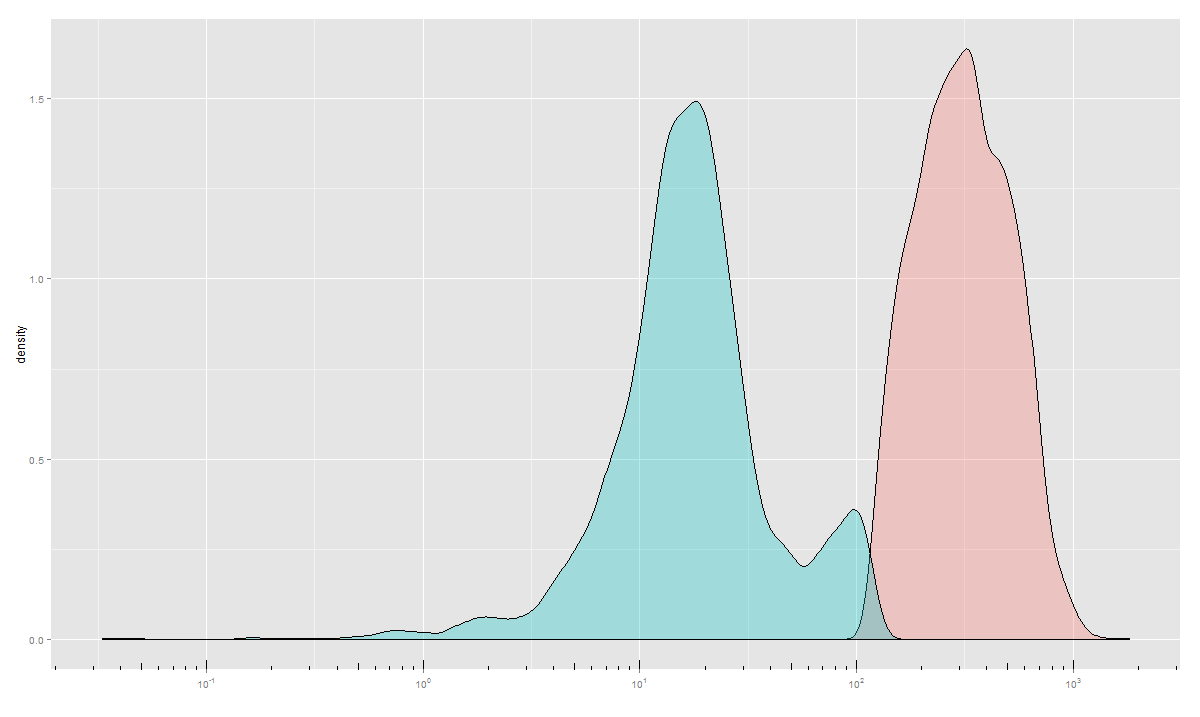
I've been using a k-means-based algorithm in R to cluster the data and thus to classify the objects. Here is a typical example of the clustering result, shown as a density plot:

As you can see, although the algorithm does distinguish two populations, it includes a part of the positive objects into the negative cluster (the blue one). You can also see that there are some extremely negative outliers, causing the blue curve to be skewed to the right. These outliers are artefacts, resulting from the method the values are measured and calculated, and I'd like to find a cut-off to exclude them in future.
Now, I'd like to fit a normal distribution curve the the negative population and to define a cut-off for those artefacts (outliers) based on this fit as well as to estimate some characteristics of the distribution. I was trying to do this by extracting only those objects that fall into the blue cluster and then fitting a normal distribution on them, but obviously this doesn't work out, mainly due to the bump on the right of the blue population. So I need another classification algorithm that would a priori assume the existence of two Gauss distributions and fit them (in the best case taking into account the possibility of the existence of outliers). However, so far I haven't been able to find an algorithm that would be reliable and fast enough (I've got around 20,000-50,000 objects), although I'm sure there must be a simple way in R to do so.
So in summary, I'm looking for a classiciation algorithm implemented in R to fit a normal distribution to the "negative" objects of my measurement, ideally taking into account that outliers do exist.
Does anyone has a suggestion how to accomplish this?

mixtools(link) is what you need to fit a GMM as noted by Pat below. The functionnormalmixEMimplements the EM algorithm for the mixture of univariate normal. Use the optionkto specify the number of components (k=2for a two component andk=3for a three component mixture). $\endgroup$