1
$\begingroup$

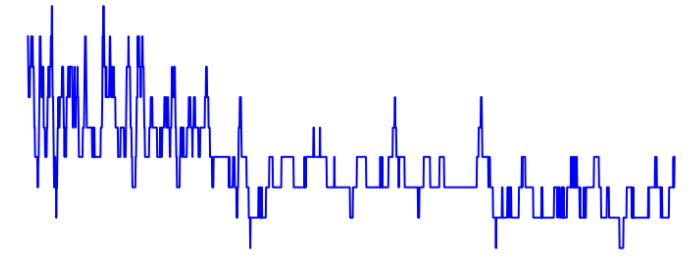
I have a velocity timeseries which is not stationary (Fig. 1). In other words, it is subject to trends and/or seasonality. I would like to report a mean velocity for this timeseries. A common way to do that in my field is to plot the autocorrelation function, take the value x at the zero crossing and then sample the time series using x. That would yield n independent samples.

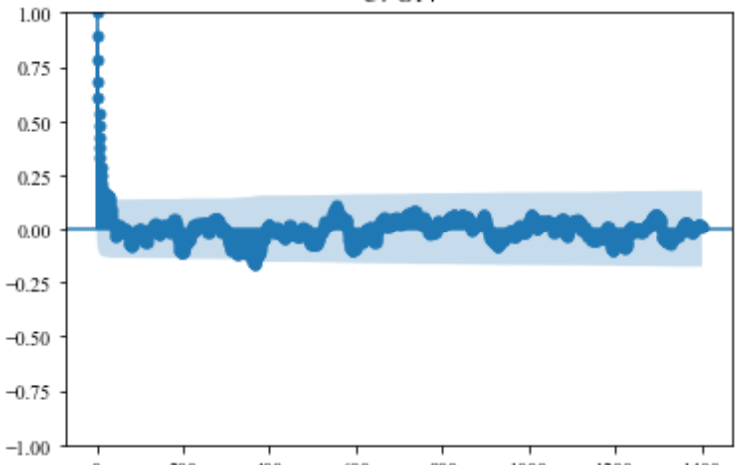
However, my autocorrelation function oscillates (Fig. 2), which, according to Smith et al., 2018, means that my timeseries is anti-correlated, rendering the aforementioned method useless, and that the number of effective samples (Neff) is actually larger than the number of samples (N). To be quite frank, I'm not sure what Neff > N means and how to proceed with the calculation of the mean. The authors suggested bootstrapping but I'm not sure it works for anti-correlated data.

Fig. 1 Fig. 2

Smith et al., 2018. https://iopscience.iop.org/article/10.1088/1361-6501/aae91d/meta

$\endgroup$
2
  • $\begingroup$ are you interested in the mean of the whole series or the mean value near the end? because if you are interested in the mean of the whole series I can't see what else to use other than the sample mean. $\endgroup$ Commented Oct 6, 2022 at 19:00
  • 1
    $\begingroup$ @DavidVeitch That's the thing. The time series was meant to be stationary; measured under steady conditions. In other words, I should have been able to take the mean and report the time-averaged velocity. However, that's not the case in reality. Now that I see that the process is non stationary and the distribution of this time series in far from Gaussian, I have to either (a) make it Gaussian by removing all time-dependent values (b) not do anything at all. So far I'm looking for (a). $\endgroup$
    – Eugene
    Commented Oct 6, 2022 at 19:38

1 Answer 1

1
$\begingroup$

I have found a solution and would like to show it, although applied to a different timeseries, because, admittedly, I do not remember which one I used in this post :).

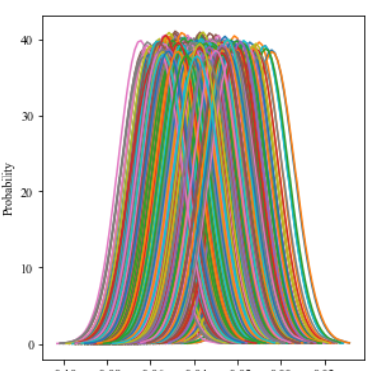
I performed moving block bootstrapping (mbb) on my timeseries, using tsmoothie and with the help of this blog post. Mbb respects the time-dependecy of the data, while resampling it into an empirical distribution (Fig 1.). As a result, I obtain a range of mean, standard deviation, etc. values, for a specified confidence interval (Fig. 2)

Fig. 1 Fig. 2

$\endgroup$
4
  • 1
    $\begingroup$ Are you sure this complicated procedure beats the sample mean? You could find this out by simulating data that have characteristics of your original data, applying the two different estimation techniques and comparing the results. $\endgroup$ Commented Oct 10, 2022 at 17:02
  • $\begingroup$ @RichardHardy Perhaps, always good to try. The mean changes over time due to the time-dependency of the data. Could you elaborate on how I would quantify the uncertainty of the mean by simply calculating the sample mean? $\endgroup$
    – Eugene
    Commented Oct 11, 2022 at 9:15
  • 1
    $\begingroup$ Unfortunately, you would not. (It was not clear to me from your question that you were interested in estimating uncertainty in the first place.) $\endgroup$ Commented Oct 11, 2022 at 9:52
  • $\begingroup$ @RichardHardy Indeed, I figured that out along the way, my apologies. $\endgroup$
    – Eugene
    Commented Oct 11, 2022 at 12:05

Your Answer

By clicking “Post Your Answer”, you agree to our terms of service and acknowledge you have read our privacy policy.

Not the answer you're looking for? Browse other questions tagged or ask your own question.