1
$\begingroup$

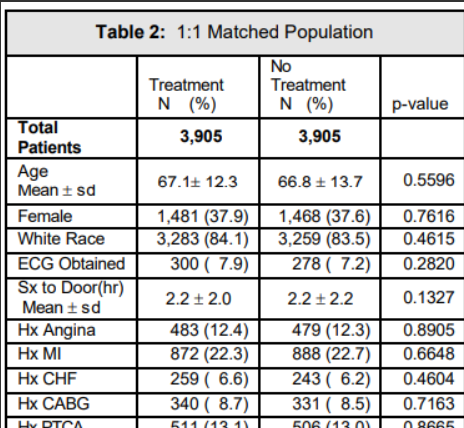
I am hoping someone can help me with figuring out something I came across in this article ((https://support.sas.com/resources/papers/proceedings/proceedings/sugi29/165-29.pdf). On page 5 the authors say that "For the matched analysis, differences between matched pairs were evaluated using the signed rank test for continuous data and the McNemar's test for binary data" and give Table 2:

enter image description here

But I'm a bit confused because as far as I understand, for Wilcoxon signed rank you compute the difference between the two continuous values for each pair and then you use that difference as the analysis variable. So this might be a dumb question but how did they obtain age mean (sd), for example, for treatment and no treatment groups by using the signed rank test?

I would like to obtain a similar table for some sample data I have but not sure how to do it. Here is the sample data and SAS code I have for Wilcoxon signed rank test. Can somebody show me some SAS code for how to obtain a table similar to the one in the paper, with a N, mean (SD), median (IQR) and p-value comparison between my two disease groups? disease=1 denotes presence of disease (case), and group links the case with its matched control:

data exam;
    input id $ age race $ gender $ creat cmv $ disease $ group;
cards;
0001 19 2 2 23 1 1 1 
0017 19 2 2 28 0 0 1 
0002 10 2 1 43 1 1 2 
0005 10 2 1 26 1 0 2 
0060 15 2 2 54 1 1 3 
0010 15 2 2 43 0 0 3 
0018 14 2 2 120 1 1 4 
0105 14 2 2 29 1 0 4 
0008 18 2 1 36 1 1 5 
0022 18 2 1 57 0 0 5 
0548 15 2 1 49 0 1 6 
0052 15 2 1 100 1 0 6 
0059 13 2 1 95 0 1 7 
0982 13 2 1 65 1 0 7 
0047 12 2 1 20 1 1 8 
0084 12 2 1 39 0 0 8 
0680 17 2 2 78 0 1 9 
0042 17 2 2 110 0 0 9 
0984 15 2 2 66 1 1 10 
0007 15 2 2 85 0 0 10 
0021 16 2 1 73 0 1 11 
0873 16 2 1 62 0 0 11 
0193 17 2 1 71 1 1 12 
0178 17 2 1 76 0 0 12 
;
run;
proc print data=exam; run;
proc sort data=exam; by group; run;
proc transpose data=exam out=exam1 prefix=creat;
    by group;
    id disease;
    var creat;
run;
proc print data=exam1; run;

data exam1;
    set exam1;
    rename creat1=DISEASE_creat creat0=NODISEASE_creat;
run;
proc print data=exam1; run;

data final;
    set exam1;
    diff=DISEASE_creat-NODISEASE_creat;
run;
proc print data=final; run;

/*perform Wilcoxon Signed Rank Test*/
proc univariate data=final;
    var diff;
run;
$\endgroup$

1 Answer 1

2
$\begingroup$

how did they obtain age mean (sd), for example, for treatment and no treatment groups by using the signed rank test?

They did not obtain those things from or as a result of the signed rank test.

First they took the actual collection of ages, for example -- I'll use age as the example from now on but the same notion applies to the other non-dichotomous variables in the original table.

They then computed within each group (treatment/no treatment) the mean (and standard deviation) of age. These values are reported in the table.

They then computed a signed rank test on age across group. The p-values for those tests are reported in the table.

The table very much gives the impression that they're testing for a difference in mean age, but they are not.

Note that there's not necessarily any correspondence between the summary figures given and the outcome of the test.

It would be perfectly possible that mean ages differ in one direction but the effect detected by the signed rank test could be in the opposite direction. Or it would be possible to mean ages to be identical but the test detects a difference in ages. Or for the measure of age-difference that the test corresponds to to be $0$, but for the mean ages to be quite different.

You should regard them as quite different pieces of information; they might more-or-less correspond, but they don't need to.

$\endgroup$
2
  • $\begingroup$ Glen_b, thank you so much for your thorough explanation, this helps a lot! Would you recommend I do the same for my data, i.e., present the mean(SD) of my continuous variable (creatinine) for each group (disease vs no disease) with the p-value from the signed rank test on the difference in mean creatinine between the pairs (disease patients matched 1:1 with non-diseased)? Or is there a better way to present these summary statistics? $\endgroup$
    – R. Simian
    Commented Oct 12, 2022 at 2:20
  • 1
    $\begingroup$ You should present information that makes sense to present in your context (which I don't know; you know what you want to find out). If you're specifically interested in means, I would present them but then I'd make sure to use a test that corresponds to that (not necessarily a t-test, there's more than one way to test means). If you're really interested in a signed rank test, I'd consider presenting the corresponding measure of location difference, since it implies that's of interest too (that's what you're performing inference on, so presumably the sample quantity is relevant to you). $\endgroup$
    – Glen_b
    Commented Oct 12, 2022 at 22:53

Your Answer

By clicking “Post Your Answer”, you agree to our terms of service and acknowledge you have read our privacy policy.

Not the answer you're looking for? Browse other questions tagged or ask your own question.