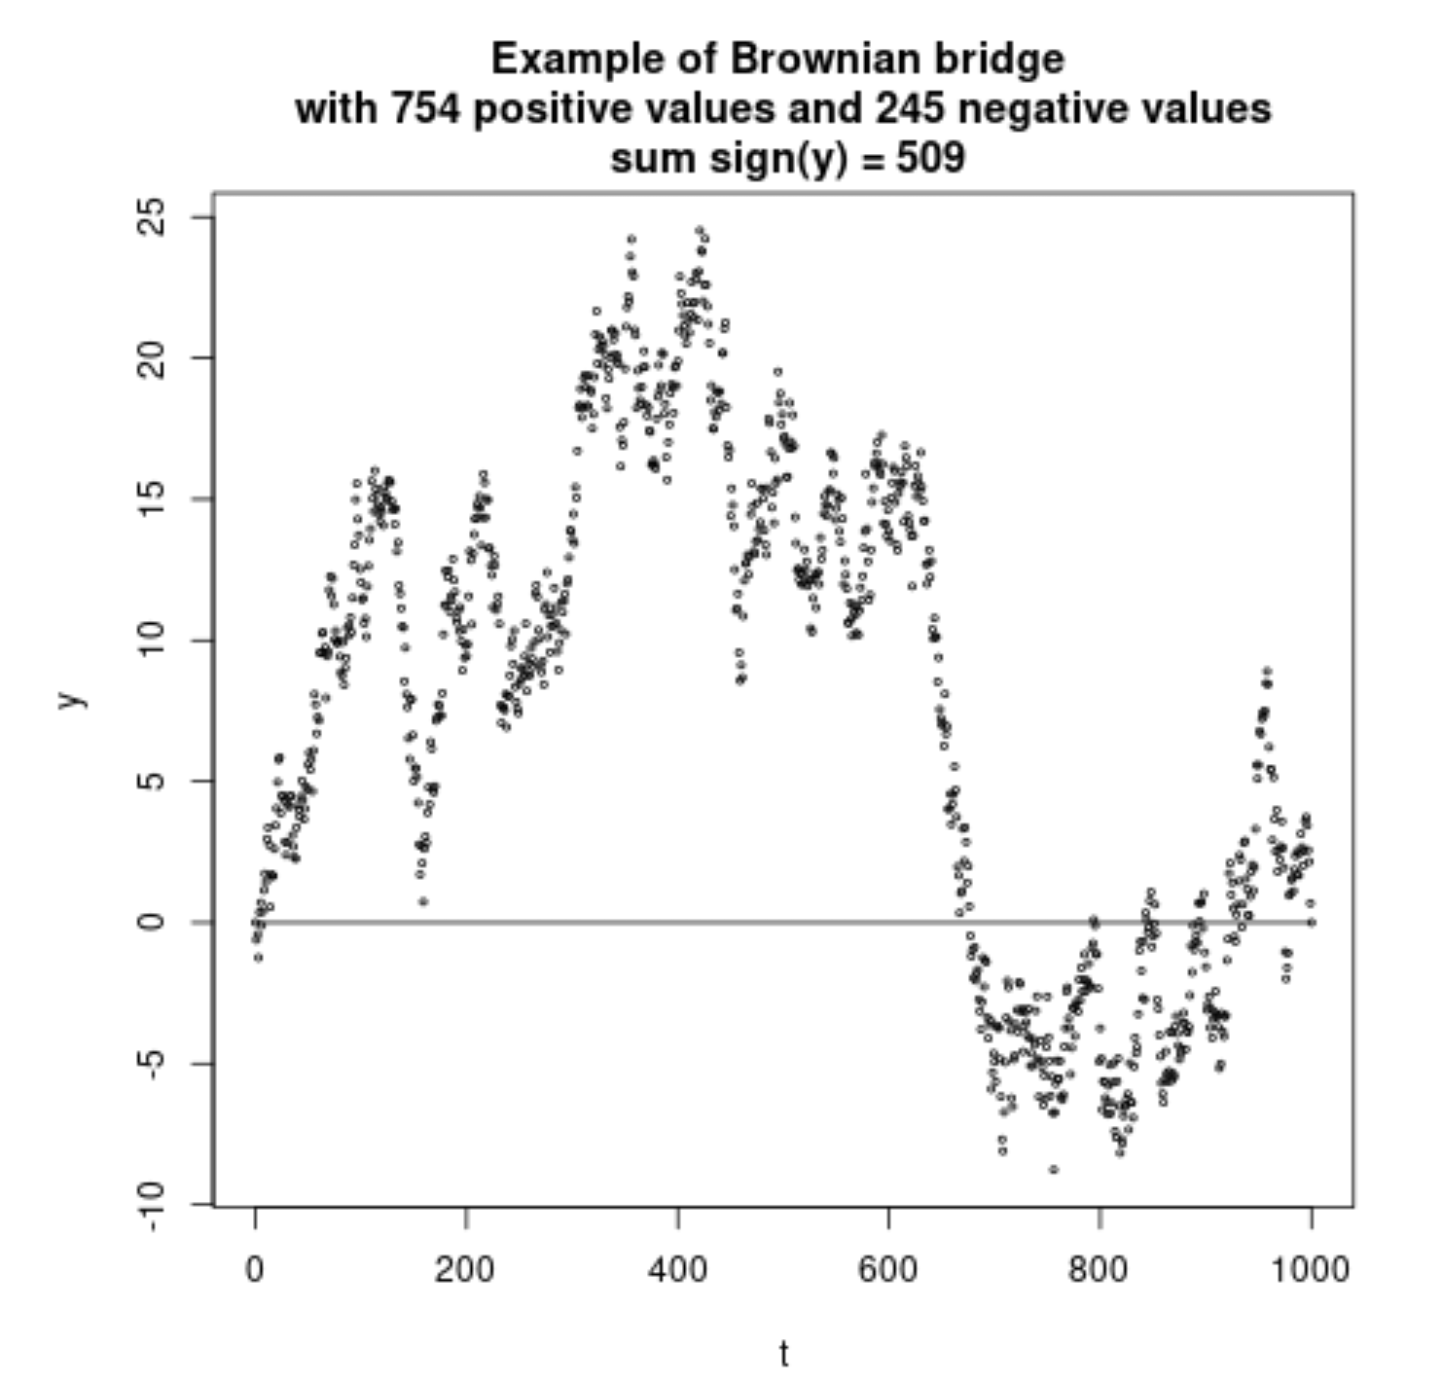
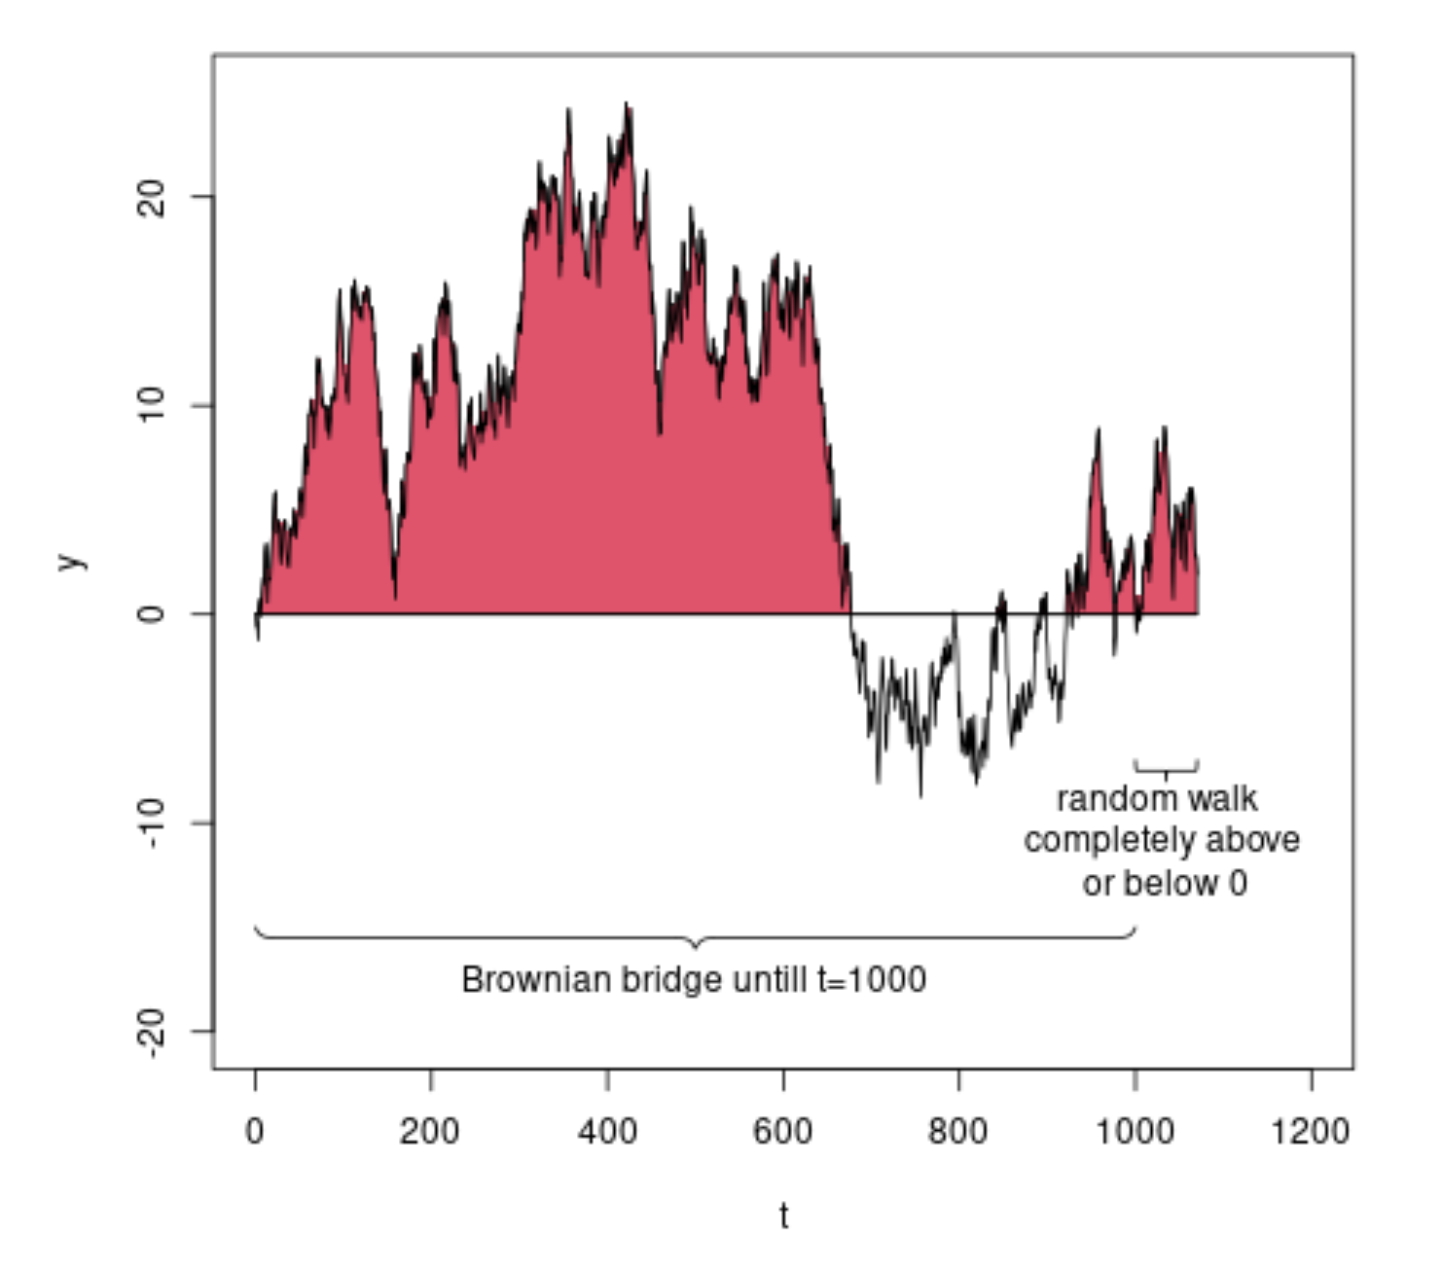
Recently there was a question about the occurrence of a large discrepancy in the differences between two ordered sequences of random numbers. The difference between these two sequences can be related to a process that approaches a scaled zero mean Brownian bridge and it is due to the correlation that there is a large variance in the number of negative and positive values.
I wonder, can we make an approximation of the distribution of positive and negative values?
A more formal description of the question:
Say we compute $T+1$ values $X_t$, with $t = 0,1,2,\dots,T$, as a multivariate Gaussian distribution with zero mean and the following covariance structure $$\Sigma_{s,t} = \text{min}(s,t) - \frac{st}{T}$$ That is, it has the same mean and covariance of a Brownian bridge. Then what is the distribution of the following?
$$S = \sum_{t=0}^T \text{sign}(X_t)$$
Example of a single simulated Brownian bridge:
set.seed(1)
x = c(0,rnorm(1000))
t = 0:1000
y = cumsum(x)-sum(x)*t/1000

S = sum(sign(y))

plot(t,y, main = "Example of Brownian bridge \n with 754 positive values and 245 negative values \n sum sign(y) = 509", cex= 0.4)

lines(t,t*0)


