6
$\begingroup$

Recently there was a question about the occurrence of a large discrepancy in the differences between two ordered sequences of random numbers. The difference between these two sequences can be related to a process that approaches a scaled zero mean Brownian bridge and it is due to the correlation that there is a large variance in the number of negative and positive values.

I wonder, can we make an approximation of the distribution of positive and negative values?


A more formal description of the question:

Say we compute $T+1$ values $X_t$, with $t = 0,1,2,\dots,T$, as a multivariate Gaussian distribution with zero mean and the following covariance structure $$\Sigma_{s,t} = \text{min}(s,t) - \frac{st}{T}$$ That is, it has the same mean and covariance of a Brownian bridge. Then what is the distribution of the following?

$$S = \sum_{t=0}^T \text{sign}(X_t)$$


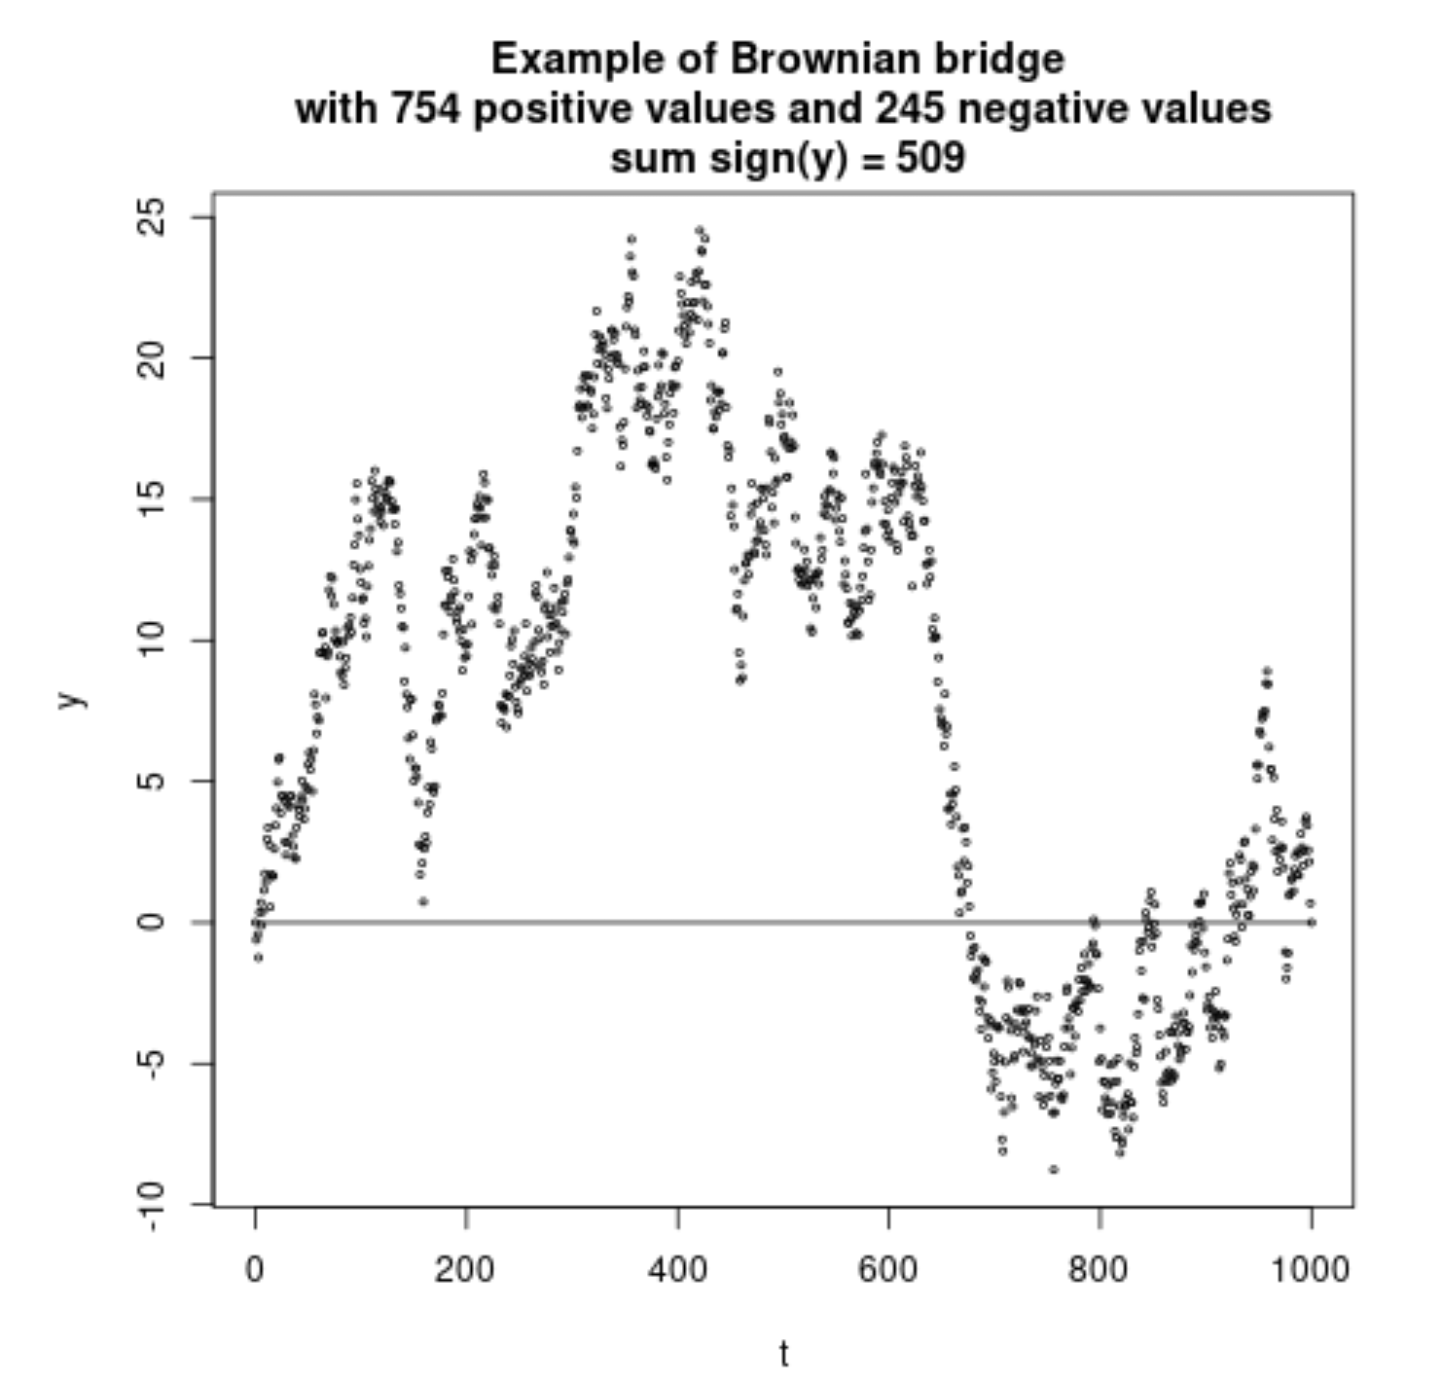
Example of a single simulated Brownian bridge:

example of Brownian bridge and computation of sum S

set.seed(1)
x = c(0,rnorm(1000))
t = 0:1000
y = cumsum(x)-sum(x)*t/1000

S = sum(sign(y))
        
plot(t,y, main = "Example of Brownian bridge \n with 754 positive values and 245 negative values \n sum sign(y) = 509", cex= 0.4)

lines(t,t*0)
$\endgroup$
9
  • $\begingroup$ Maybe the self similarity of the Brownian bridge (a sub section that starts and ends between zero is itself a scaled Brownian bridge) could be used to derive a distribution? $\endgroup$ Commented Oct 22, 2022 at 9:48
  • $\begingroup$ Here is a Python gist producing a similar plot. I didn't set an equivalent seed, or set the seed at all, so the plot numbers will differ from here. $\endgroup$
    – Galen
    Commented Oct 22, 2022 at 16:51
  • $\begingroup$ An interesting observation, I did a simulation and the distribution of the sum $S$ appears to be uniform. $\endgroup$ Commented Oct 22, 2022 at 19:20
  • $\begingroup$ I performed a similar simulation (here). Curious that CLT didn't approximately kick in with $10^5$ samples of $S$. $\endgroup$
    – Galen
    Commented Oct 22, 2022 at 19:50
  • $\begingroup$ Could it be that the summands that define $S$ are not independent? The random variables in a Brownian bridge are not independent. $\endgroup$
    – Galen
    Commented Oct 22, 2022 at 19:59

1 Answer 1

2
$\begingroup$

The distribution is uniform.

A more well known related relationship is Lévy's arcsine law: the distribution of time that a random walk is positive follows an arcsine distribution (or Beta 1/2,1/2).

On mathematics the same question was asked and answered Distribution of time spent above 0 by a Brownian Bridge.

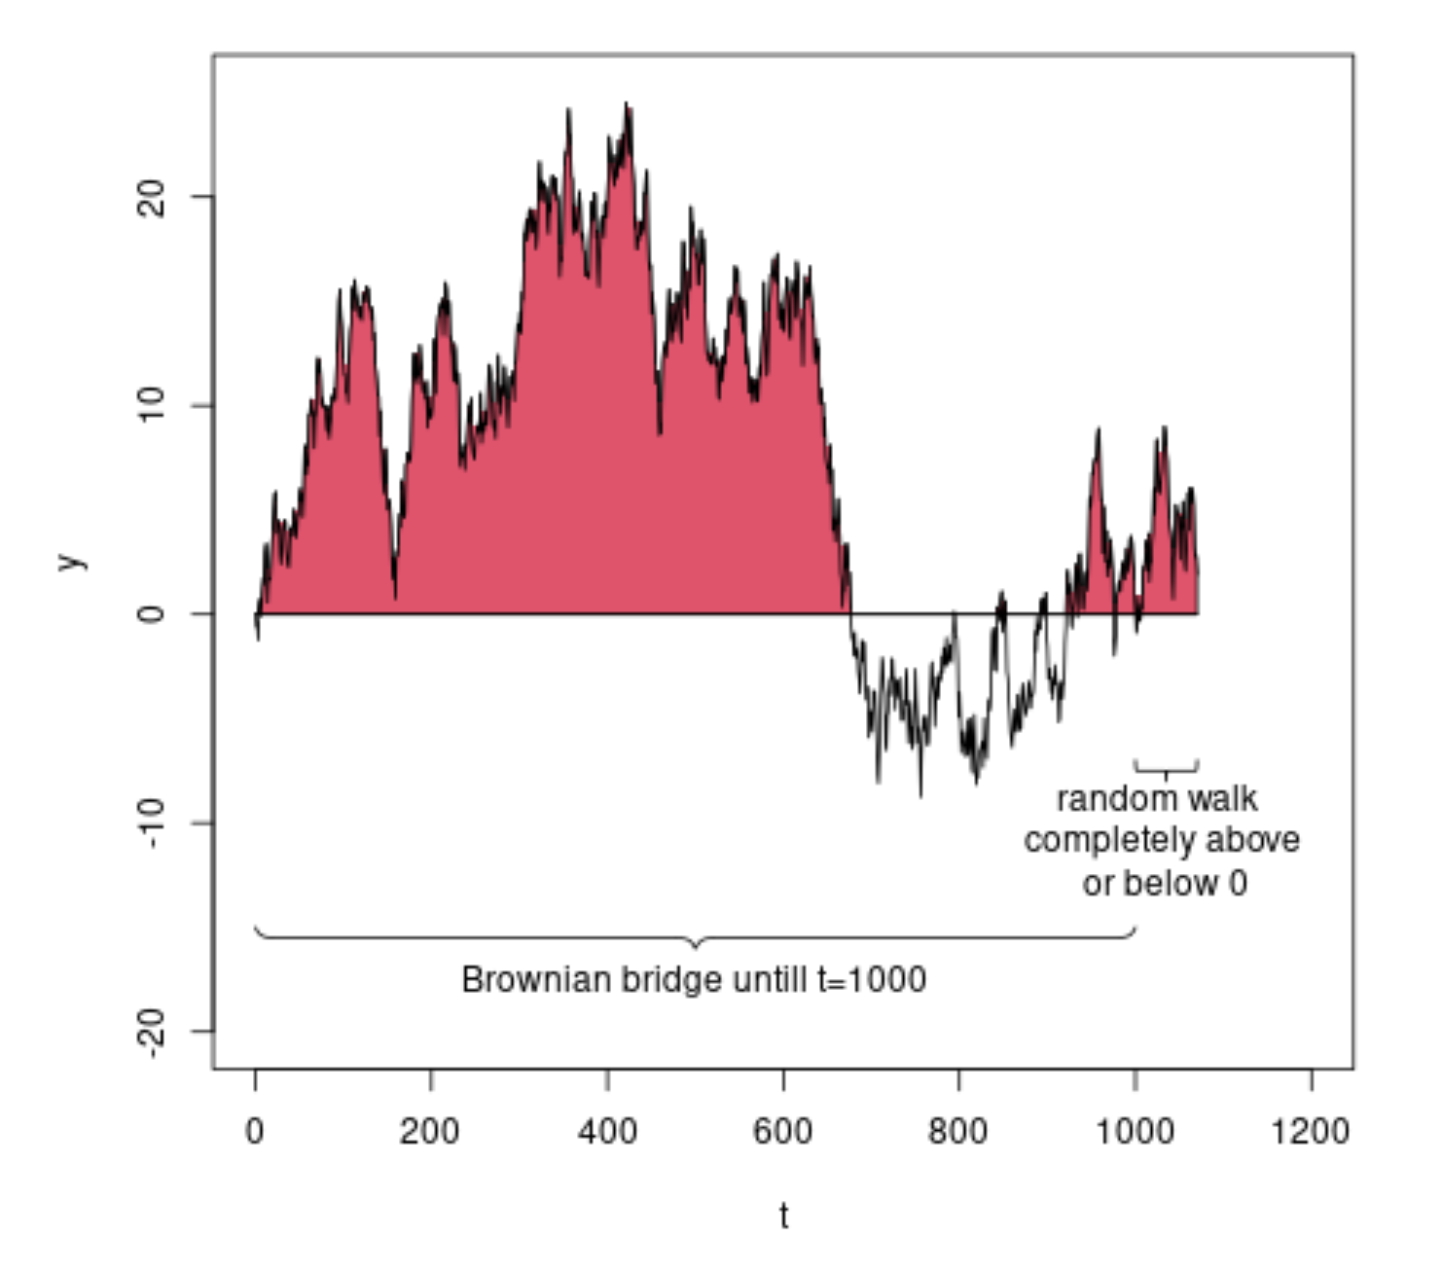
We should be able to derive the uniform distribution of the Brownian bridge by using the arcsine laws for the Wiener process. Schematically it looks like below.

example for derivation

The Wiener process can be viewed as the combination of a scaled Brownian bridge at times below $t$, and a final piece that is entirely below or above zero at times above $t$.

Then the fraction of time that the Wiener process is above zero $f_W$ is equal to

$$f_W = t \cdot f_B + (1-t) \cdot X$$

where $f_B$ is the fraction of time that the Brownian bridge is above zero, $t$ is the last time since the random walk hits zero, and $X$ is a Bernoulli variable (the last part is fifty-fifty either all positive or all negative).

With the arcsine laws we know that $f_W,t \sim B(0.5,0.5)$ with this we should be able to derive $f_B$ (I still have to work that part out, but this seems to be the strategy to get from the arcsine laws for the Brownian motion to the laws for the Brownian bridge).

$\endgroup$

Your Answer

By clicking “Post Your Answer”, you agree to our terms of service and acknowledge you have read our privacy policy.

Not the answer you're looking for? Browse other questions tagged or ask your own question.