0
$\begingroup$

I have this df object (9x19),

clusters pearson..s pearson..c pearson..a spearman..s spearman..c spearman..a cosine..s cosine..c cosine..a    Z0e..s    Z0e..c    Z0e..a    Z1e..s    Z1e..c    Z1e..a    Z2e..s    Z2e..c    Z2e..a
       2  0.5220314  0.9619119  0.8902166   0.9619119   0.8566094   0.8566094 0.9619119 0.9253174 0.9619119 0.5177371 0.5177371 0.5177371 0.5177371 0.5177371 0.5177371 0.5177371 0.5371546 0.5177371
       3  0.9477222  0.9058999  0.8902166   0.9477222   0.9238237   0.9238237 0.9477222 0.9118745 0.8416729 0.5218447 0.5218447 0.5218447 0.5218447 0.5218447 0.5218447 0.5263256 0.5420090 0.5311800
       4  0.9342793  0.9029126  0.8909634   0.9223301   0.8035848   0.9118745 0.9058999 0.7735250 0.8274832 0.5261389 0.5412621 0.5412621 0.5308066 0.5308066 0.5308066 0.5308066 0.5412621 0.5308066
       5  0.8409261  0.7768857  0.8050784   0.9217700   0.7615758   0.7916355 0.8200149 0.7399178 0.8140403 0.5354742 0.5405153 0.5405153 0.5354742 0.5405153 0.5405153 0.5354742 0.5405153 0.5405153
       6  0.8065721  0.7462659  0.7923824   0.9001120   0.6719567   0.7901419 0.8065721 0.7261016 0.7826736 0.5403286 0.5403286 0.5403286 0.5352875 0.5403286 0.5403286 0.5403286 0.5403286 0.5403286
       7  0.7938760  0.6700896  0.7804332   0.8792009   0.6506721   0.7610157 0.8020911 0.7092980 0.7481329 0.5401419 0.5401419 0.5401419 0.5401419 0.5401419 0.5401419 0.5401419 0.5401419 0.5401419
       8  0.7854742  0.6671023  0.7182599   0.8590366   0.6491785   0.7520538 0.7936893 0.7078043 0.7406647 0.5311800 0.6161314 0.5311800 0.5311800 0.5085885 0.5237117 0.5311800 0.5115758 0.5237117
       9  0.7809933  0.6577670  0.7197535   0.8491412   0.6071695   0.7356236 0.7949963 0.6779313 0.7279686 0.5229649 0.6030620 0.5408887 0.5229649 0.5029873 0.5130695 0.5229649 0.5037341 0.5162435
      10  0.7823002  0.6338686  0.6898805   0.8267364   0.6023152   0.7057506 0.7823002 0.6301344 0.7160194 0.5154966 0.5537715 0.5319268 0.5154966 0.4985063 0.5067214 0.5123226 0.4992532 0.5067214

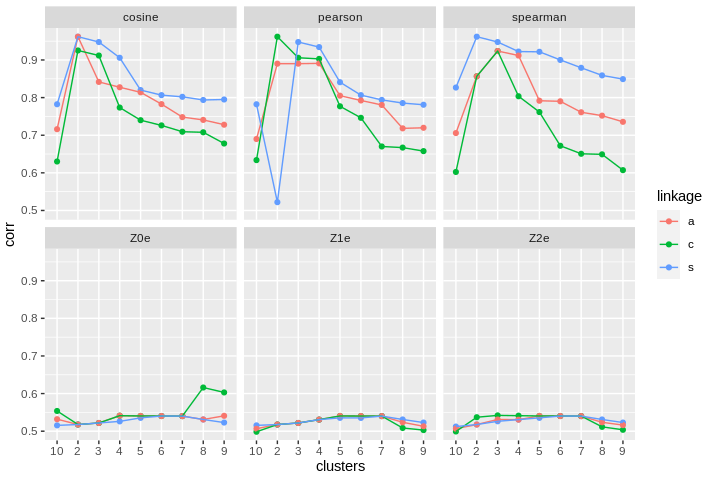
which shows the adjusted Rand index between a hierarchical clustering for a given number of clusters and the true groups in the original data. For example, df[1, 1]=0.5220314, is the adjusted Rand index for "Pearson's correlation" proximity measure along with "s" which is the "single" linkage method. Similarly, c is complete and a is average. "Spearman" is "Spearman's correlation", "Cosine" is cosine, "Z0e" is "Euclidean" for original data, whereas "Z1" and "Z2" are standardized versions of the original data.

Any recommendations for graphing are welcomed. I wish to compare firstly, the different proximity measures, and secondly, for each proximity measure, to compare the linkage method for each, for the different cluster values.

$\endgroup$
1
  • $\begingroup$ What exactly do you mean by "compare"? What do you want to take out of putting the numbers in a plot? $\endgroup$
    – dipetkov
    Commented Oct 26, 2022 at 19:34

1 Answer 1

0
$\begingroup$

My first try would be this:

R
library(data.table)
library(ggplot2)

dat <- fread('data.tsv')
dat <- melt(data=dat, id.var='clusters', value.name='corr')
dat[, clusters := as.character(clusters)]
dat[, method := sub('\\.\\..*', '', variable)]
dat[, linkage := sub('.*\\.\\.', '', variable)]
dat[, variable := NULL]
dat
     clusters      corr  method linkage
  1:        2 0.5220314 pearson       s
  2:        3 0.9477222 pearson       s
  3:        4 0.9342793 pearson       s
  4:        5 0.8409261 pearson       s
  5:        6 0.8065721 pearson       s
 ---                                   
158:        6 0.5403286     Z2e       a
159:        7 0.5401419     Z2e       a
160:        8 0.5237117     Z2e       a
161:        9 0.5162435     Z2e       a
162:       10 0.5067214     Z2e       a

gg <- ggplot(dat=dat, aes(x=clusters, y=corr, colour=linkage, group=linkage)) +
    geom_point() +
    geom_line() +
    facet_wrap(~method)

enter image description here

In the ggplot call, you could try swapping clusters with method or linkage to see if it suits your needs better.

Also, it is rarely a good idea to have factors arranged in alphabetical order so I would re-order them in a more meaningful way.

$\endgroup$
10
  • 3
    $\begingroup$ It makes little sense to place 10 clusters before 2! You should coerce that variable to a numeric quantity before plotting. $\endgroup$
    – whuber
    Commented Oct 26, 2022 at 12:40
  • $\begingroup$ @whuber yes, that's what I mean in the last sentence of my answer: it makes little sense to have alphabetical order for factors. I assume cluster number is a factor. In fact I coerce it to character. I'd say it's up to the OP to decide which is correct or more meaniningful. $\endgroup$
    – dariober
    Commented Oct 26, 2022 at 12:45
  • 1
    $\begingroup$ I believe "clusters" is a count, not an identifier: "a given number of clusters." $\endgroup$
    – whuber
    Commented Oct 26, 2022 at 12:46
  • 2
    $\begingroup$ @whuber Oh, I see - in which case one can just remove the line dat[, clusters := as.character(clusters)] $\endgroup$
    – dariober
    Commented Oct 26, 2022 at 12:49
  • $\begingroup$ @dariober the sub function you are using does not seem to work for me. My dat data.table still has pearson, s, pearson, c and so on for method and the exact same for linkage. I have tried looking up general expressions online but I have not had any luck in trying to figure it out $\endgroup$ Commented Oct 26, 2022 at 14:27

Your Answer

By clicking “Post Your Answer”, you agree to our terms of service and acknowledge you have read our privacy policy.

Not the answer you're looking for? Browse other questions tagged or ask your own question.